11
11peptides
spectra
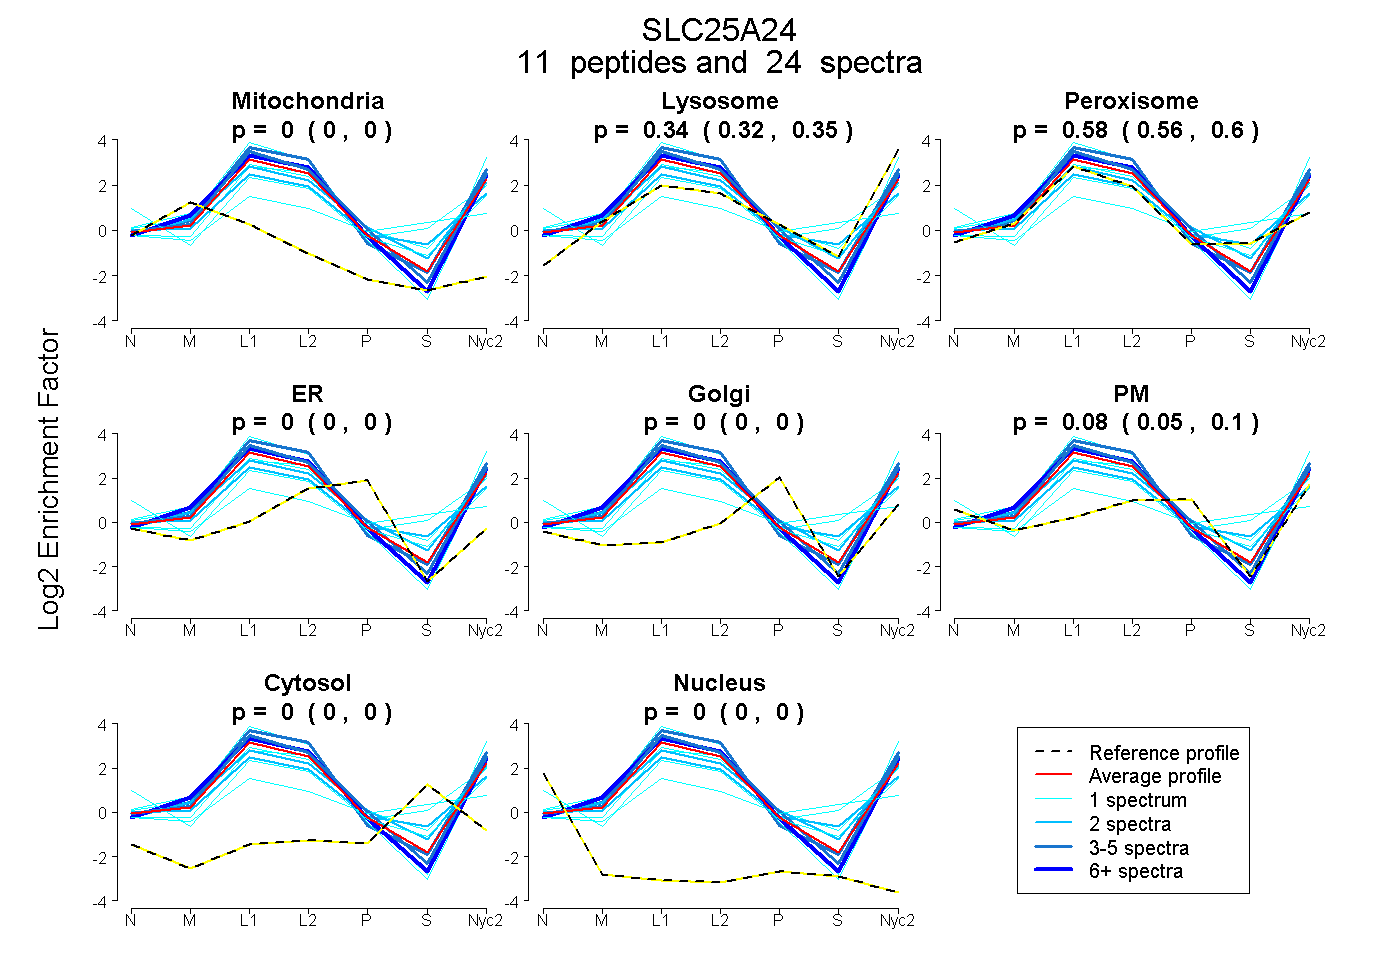
0.000 | 0.000
0.319 | 0.355
0.562 | 0.603
0.000 | 0.000
0.000 | 0.000
0.054 | 0.095
0.000 | 0.000
0.000 | 0.000
6peptides
spectra
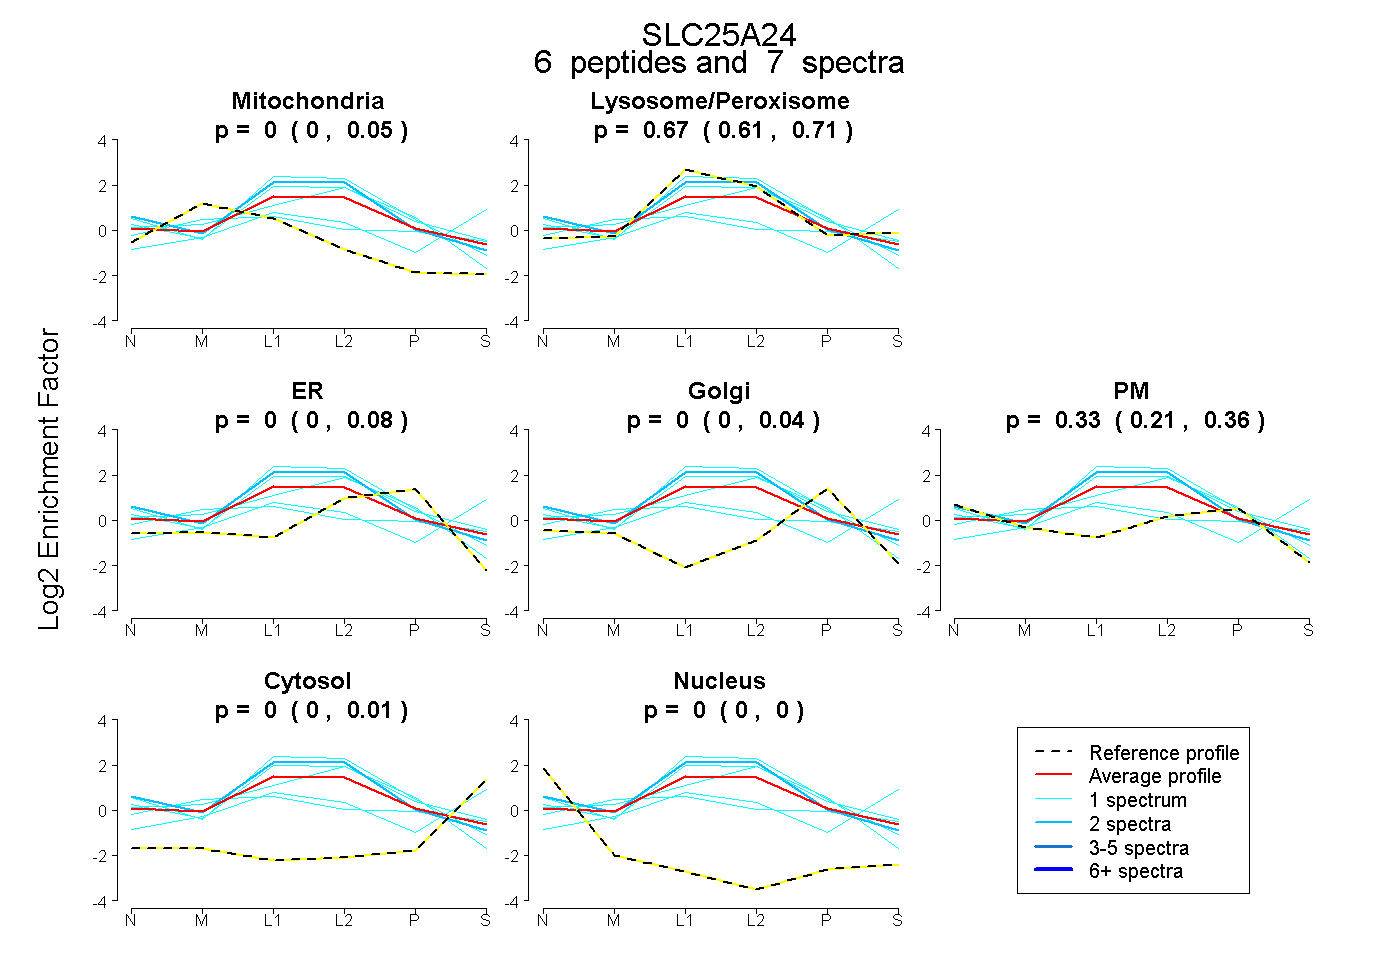
0.000 | 0.051
0.606 | 0.713
0.000 | 0.076
0.000 | 0.041
0.206 | 0.359
0.000 | 0.013
0.000 | 0.000
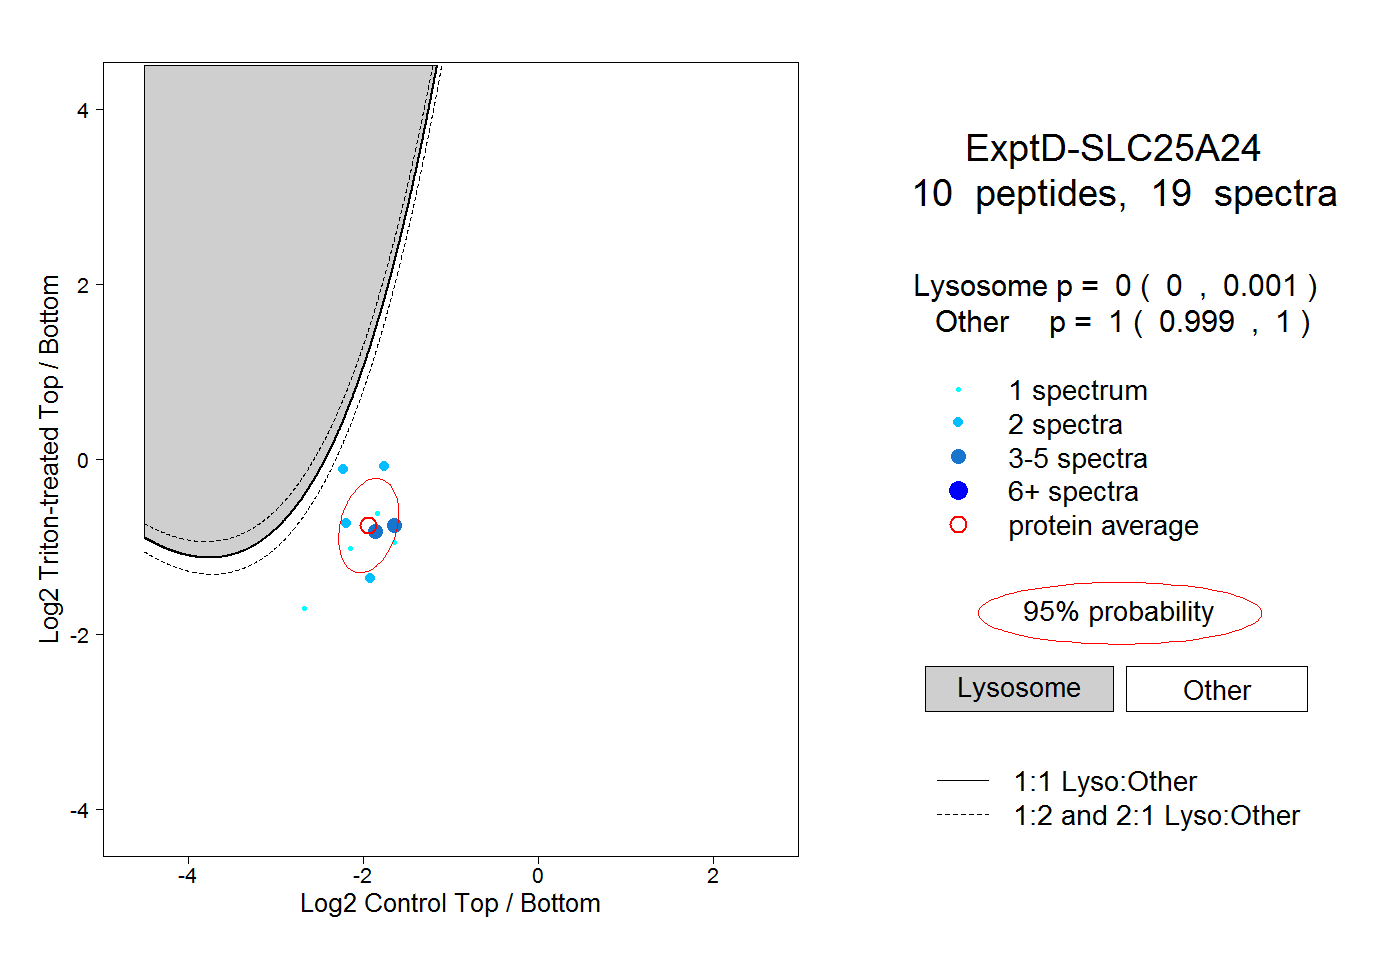
21peptides
spectra
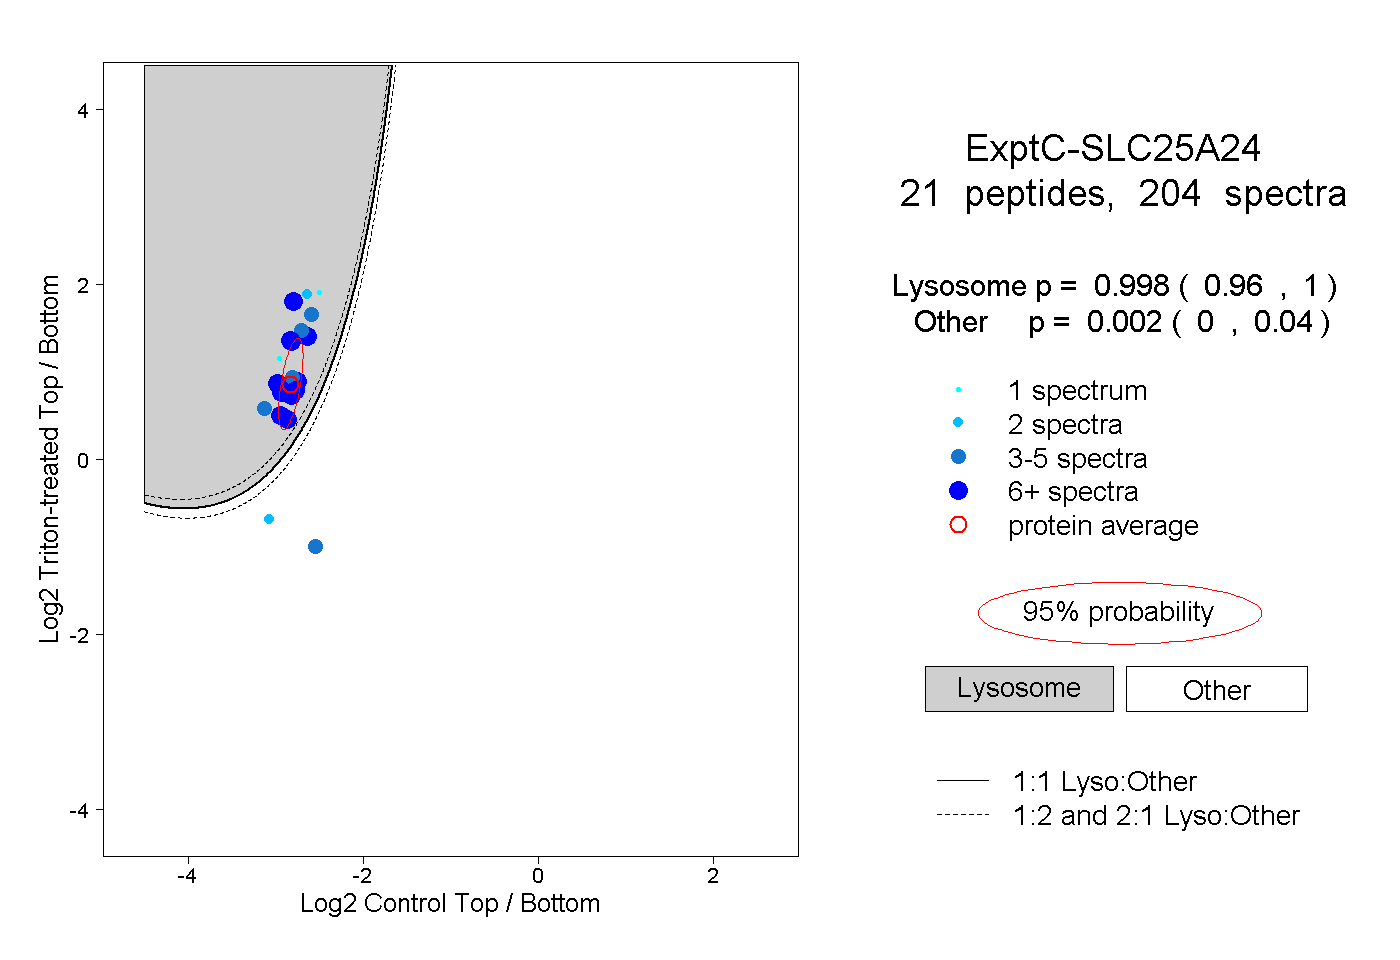
0.960 | 1.000
0.000 | 0.040