 11
11peptides
spectra
0.000 | 0.000
0.319 | 0.355
0.562 | 0.603
0.000 | 0.000
0.000 | 0.000
0.054 | 0.095
0.000 | 0.000
0.000 | 0.000
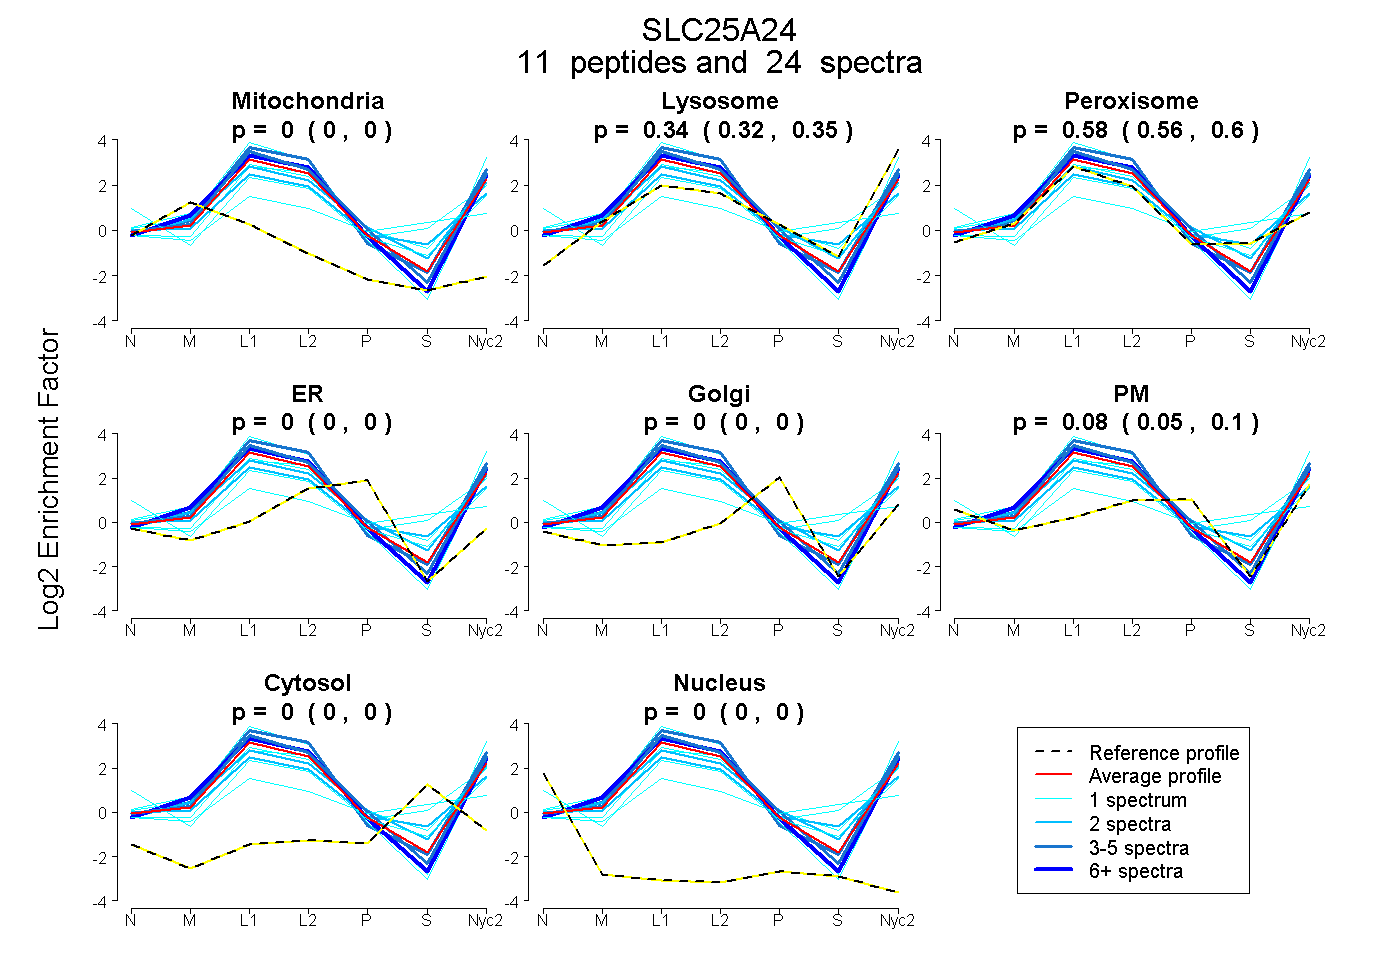
| Plot | Mito | Lyso | Perox | ER | Golgi | PM | Cytosol | Nucleus | |||||
| Expt A |
11 peptides |
24 spectra |
|
0.000 0.000 | 0.000 |
0.339 0.319 | 0.355 |
0.585 0.562 | 0.603 |
0.000 0.000 | 0.000 |
0.000 0.000 | 0.000 |
0.076 0.054 | 0.095 |
0.000 0.000 | 0.000 |
0.000 0.000 | 0.000 |
| 1 spectrum, LGTSER | 0.000 | 0.277 | 0.681 | 0.000 | 0.000 | 0.041 | 0.000 | 0.000 | ||
| 1 spectrum, VLPAVGISYVVYENMK | 0.000 | 0.031 | 0.609 | 0.000 | 0.000 | 0.114 | 0.247 | 0.000 | ||
| 7 spectra, SMNIFGGFR | 0.000 | 0.432 | 0.493 | 0.000 | 0.000 | 0.076 | 0.000 | 0.000 | ||
| 2 spectra, SGQWWR | 0.000 | 0.355 | 0.563 | 0.000 | 0.000 | 0.081 | 0.000 | 0.000 | ||
| 3 spectra, LDFEEFMK | 0.000 | 0.428 | 0.572 | 0.000 | 0.000 | 0.000 | 0.000 | 0.000 | ||
| 2 spectra, QTLGVAQK | 0.000 | 0.148 | 0.716 | 0.000 | 0.000 | 0.136 | 0.000 | 0.000 | ||
| 4 spectra, SYWLDNFAK | 0.000 | 0.425 | 0.501 | 0.000 | 0.000 | 0.073 | 0.000 | 0.000 | ||
| 1 spectrum, EGVSGLYR | 0.000 | 0.600 | 0.400 | 0.000 | 0.000 | 0.000 | 0.000 | 0.000 | ||
| 1 spectrum, IFTTGDVNK | 0.000 | 0.253 | 0.747 | 0.000 | 0.000 | 0.000 | 0.000 | 0.000 | ||
| 1 spectrum, TSTAPLDR | 0.000 | 0.000 | 0.656 | 0.000 | 0.000 | 0.344 | 0.000 | 0.000 | ||
| 1 spectrum, QLLAGGVAGAVSR | 0.000 | 0.358 | 0.493 | 0.000 | 0.000 | 0.149 | 0.000 | 0.000 |
| Plot | Mito | Lyso or Perox | ER | Golgi | PM | Cytosol | Nucleus | ||||||
| Expt B |
6 peptides |
7 spectra |
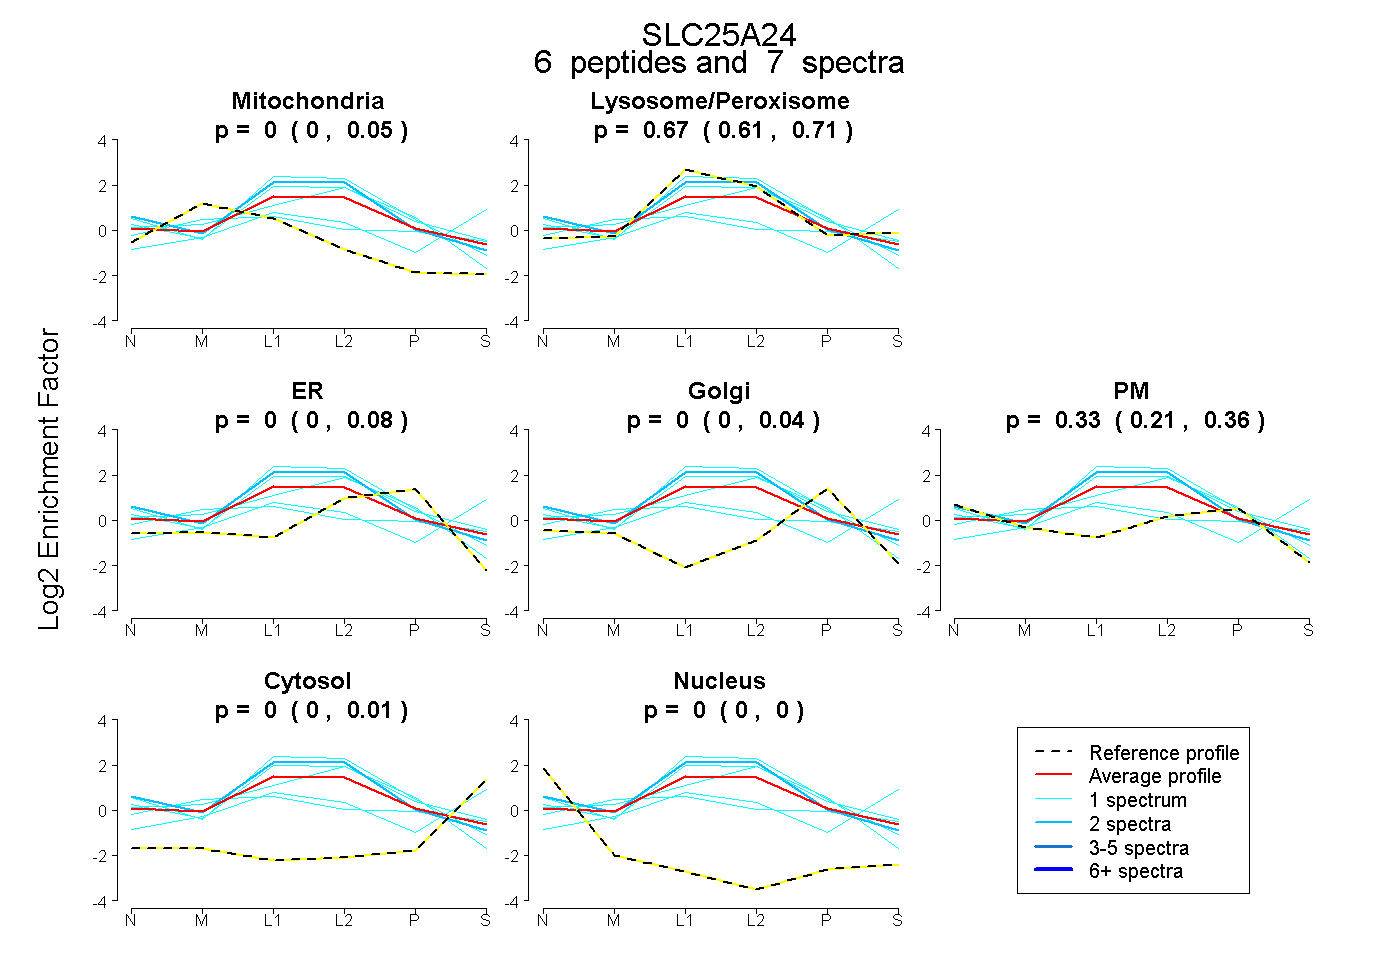 |
0.001 0.000 | 0.051 |
0.668 0.606 | 0.713 |
0.000 0.000 | 0.076 |
0.000 0.000 | 0.041 |
0.331 0.206 | 0.359 |
0.000 0.000 | 0.013 |
0.000 0.000 | 0.000 |
|||
| Plot | Lyso | Other | |||||||||||
| Expt C |
21 peptides |
204 spectra |
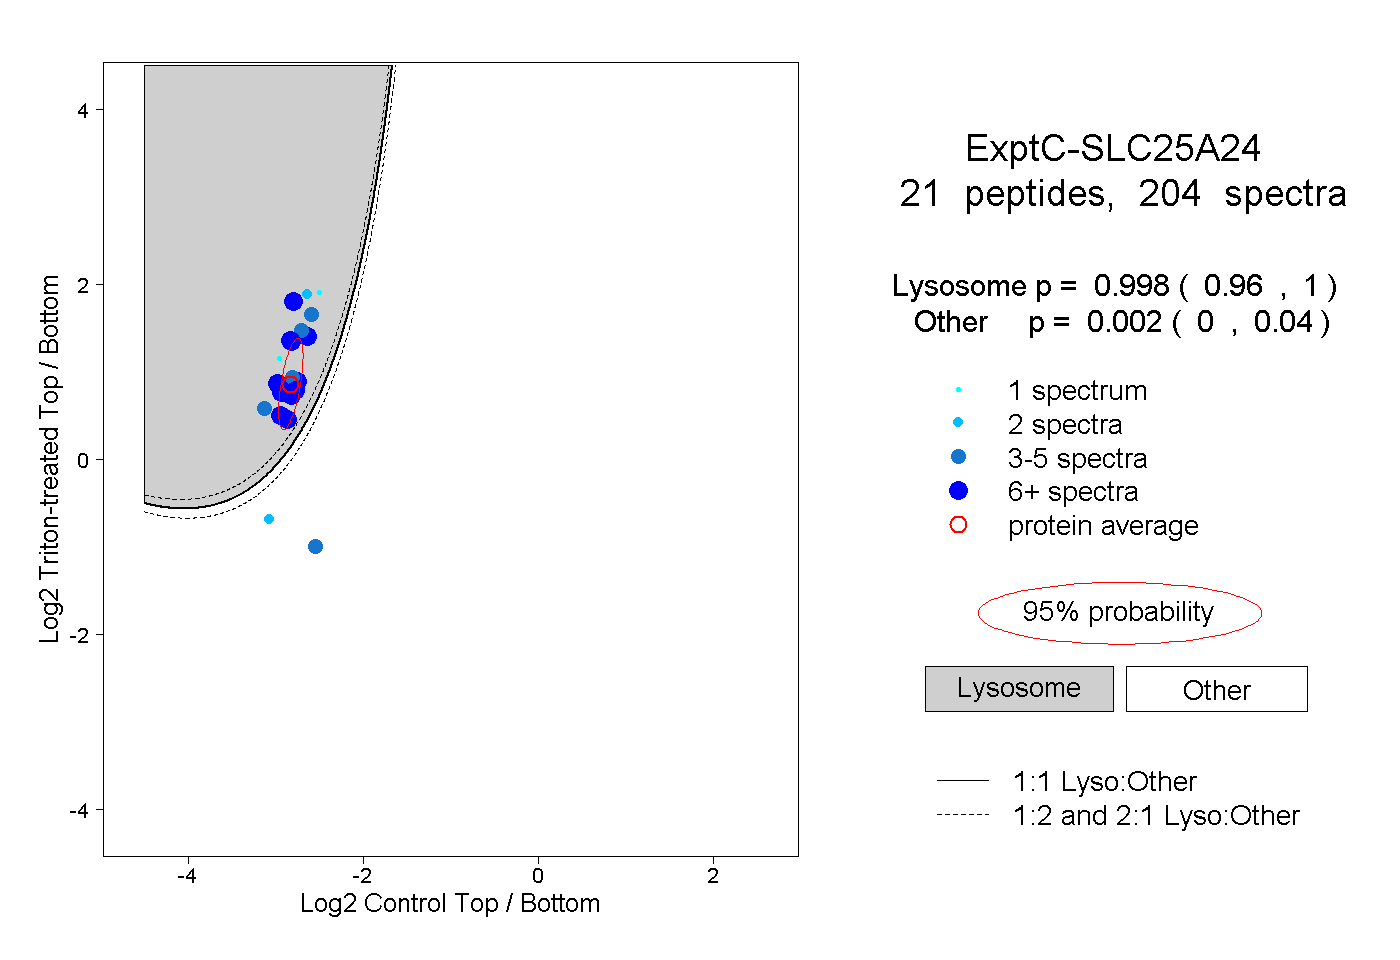 |
0.998 0.960 | 1.000 |
0.002 0.000 | 0.040 |
||||||||
| Plot | Lyso | Other | |||||||||||
| Expt D |
10 peptides |
19 spectra |
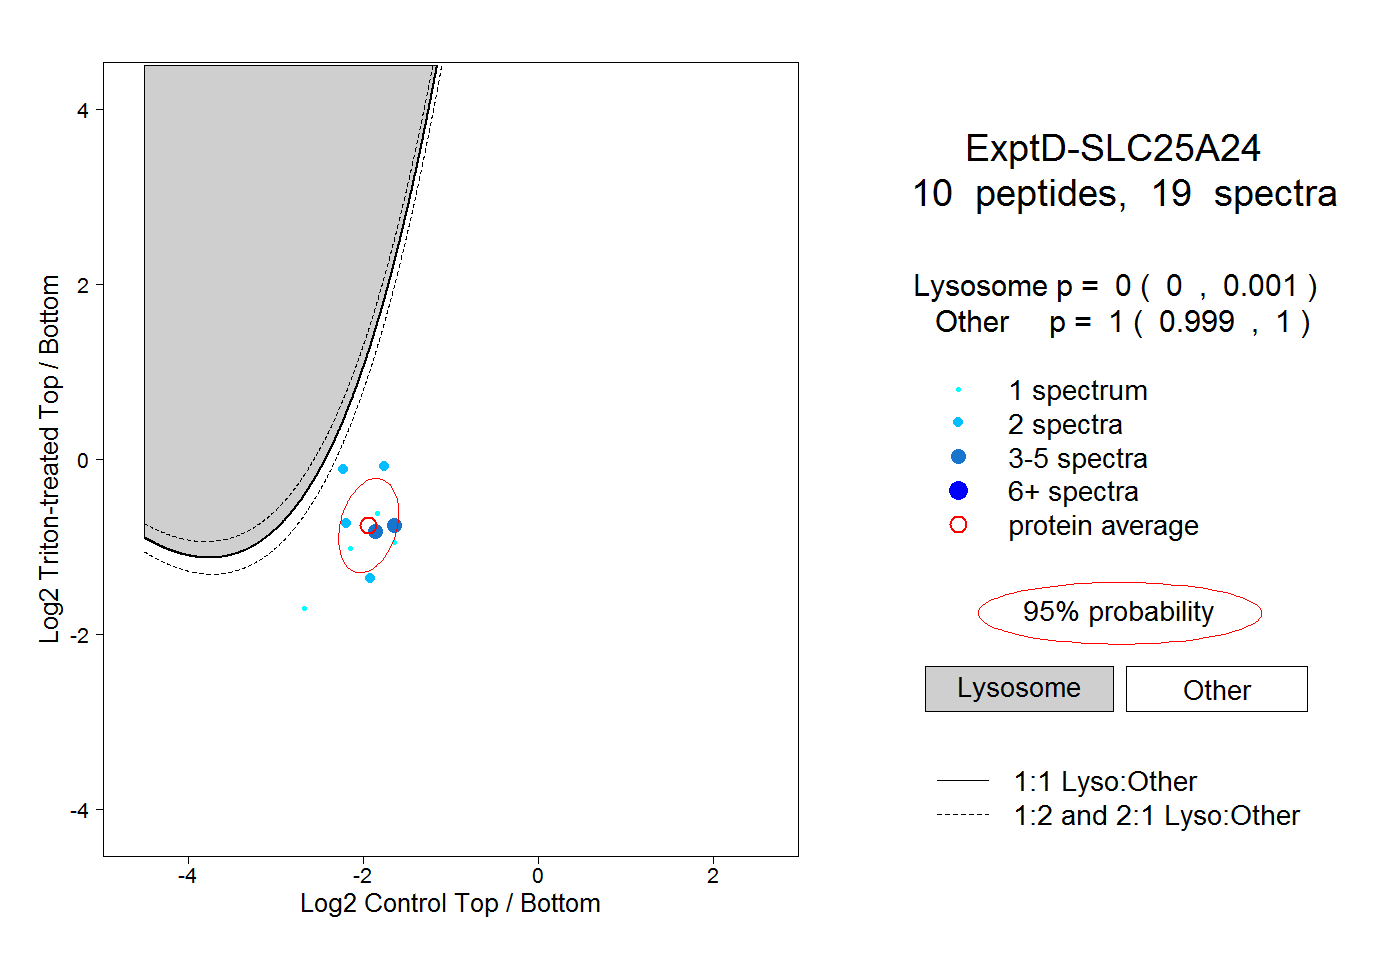 |
0.000 0.000 | 0.001 |
1.000 0.999 | 1.000 |