 1
1peptide
spectra
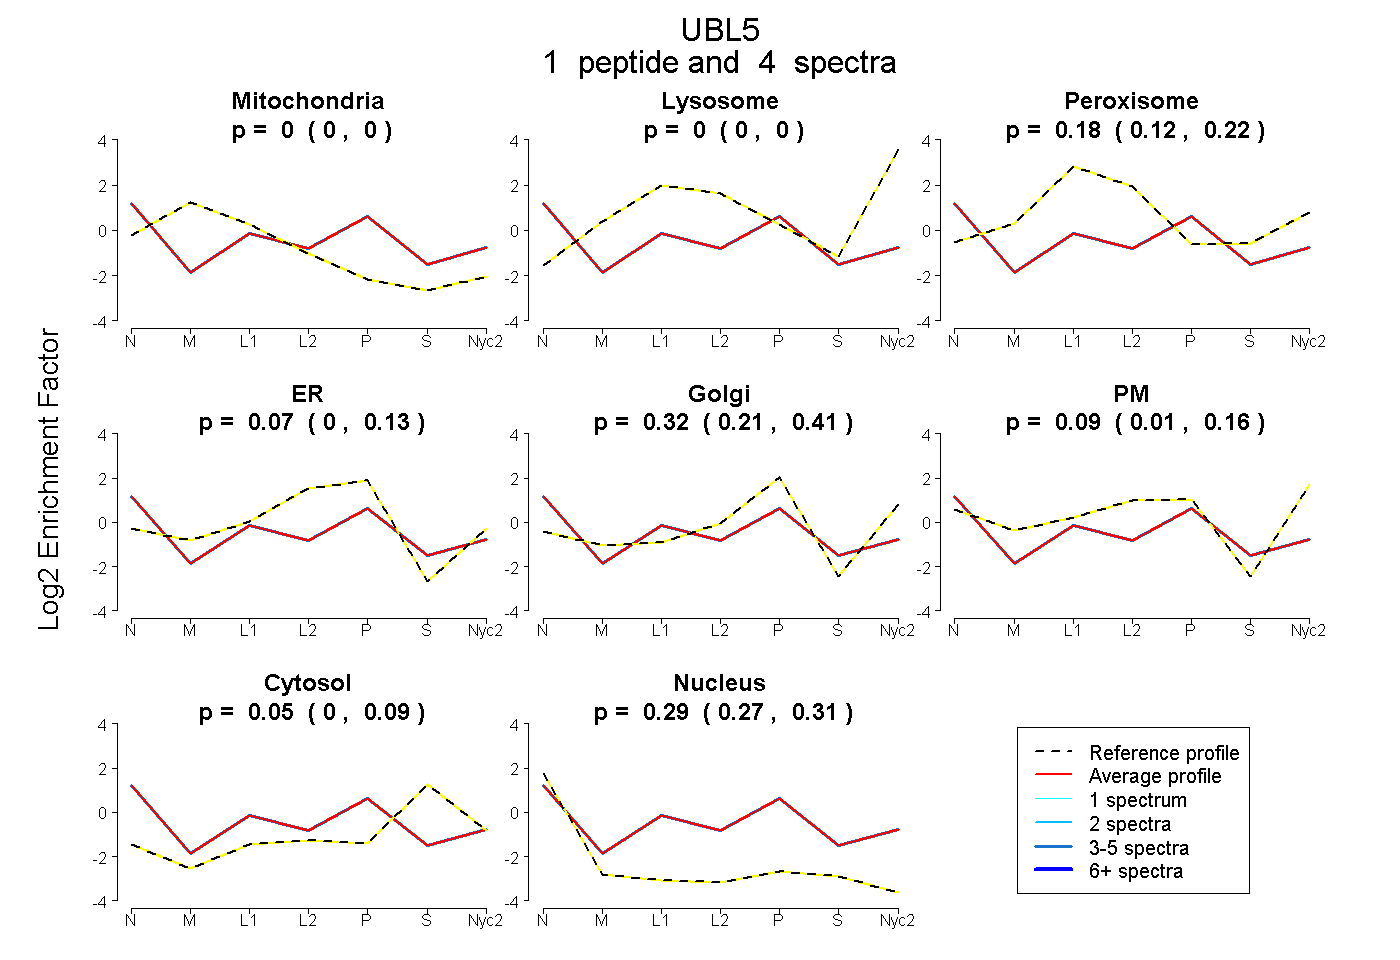
0.000 | 0.000
0.000 | 0.000
0.121 | 0.223
0.000 | 0.130
0.213 | 0.405
0.014 | 0.160
0.000 | 0.088
0.272 | 0.313
1peptide
spectra
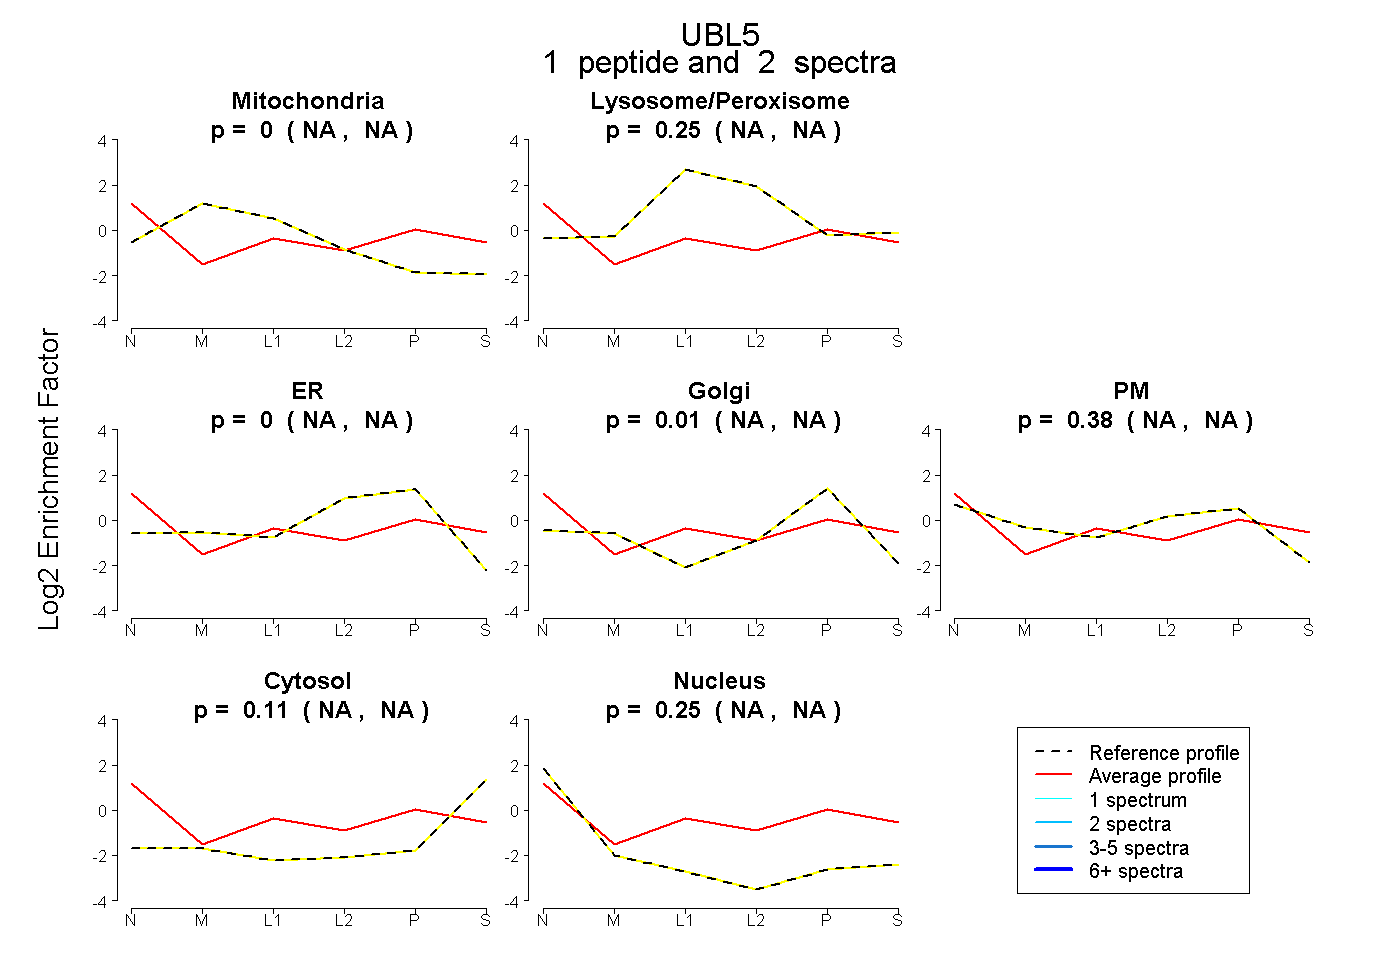
NA | NA
NA | NA
NA | NA
NA | NA
NA | NA
NA | NA
NA | NA
1peptide
spectrum
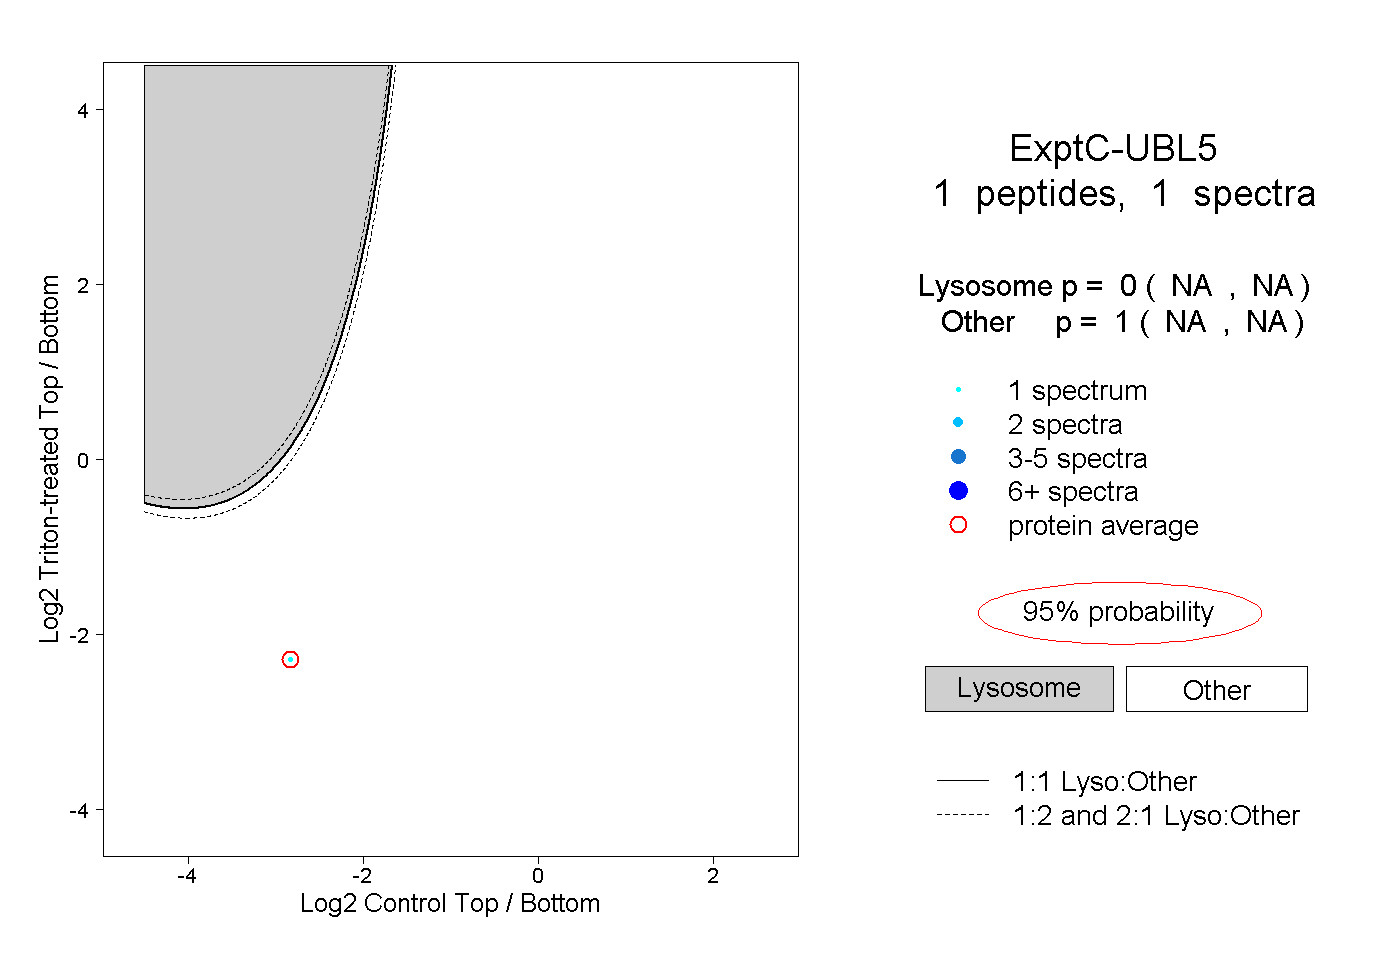
NA | NA
NA | NA