 3
3peptides
spectra
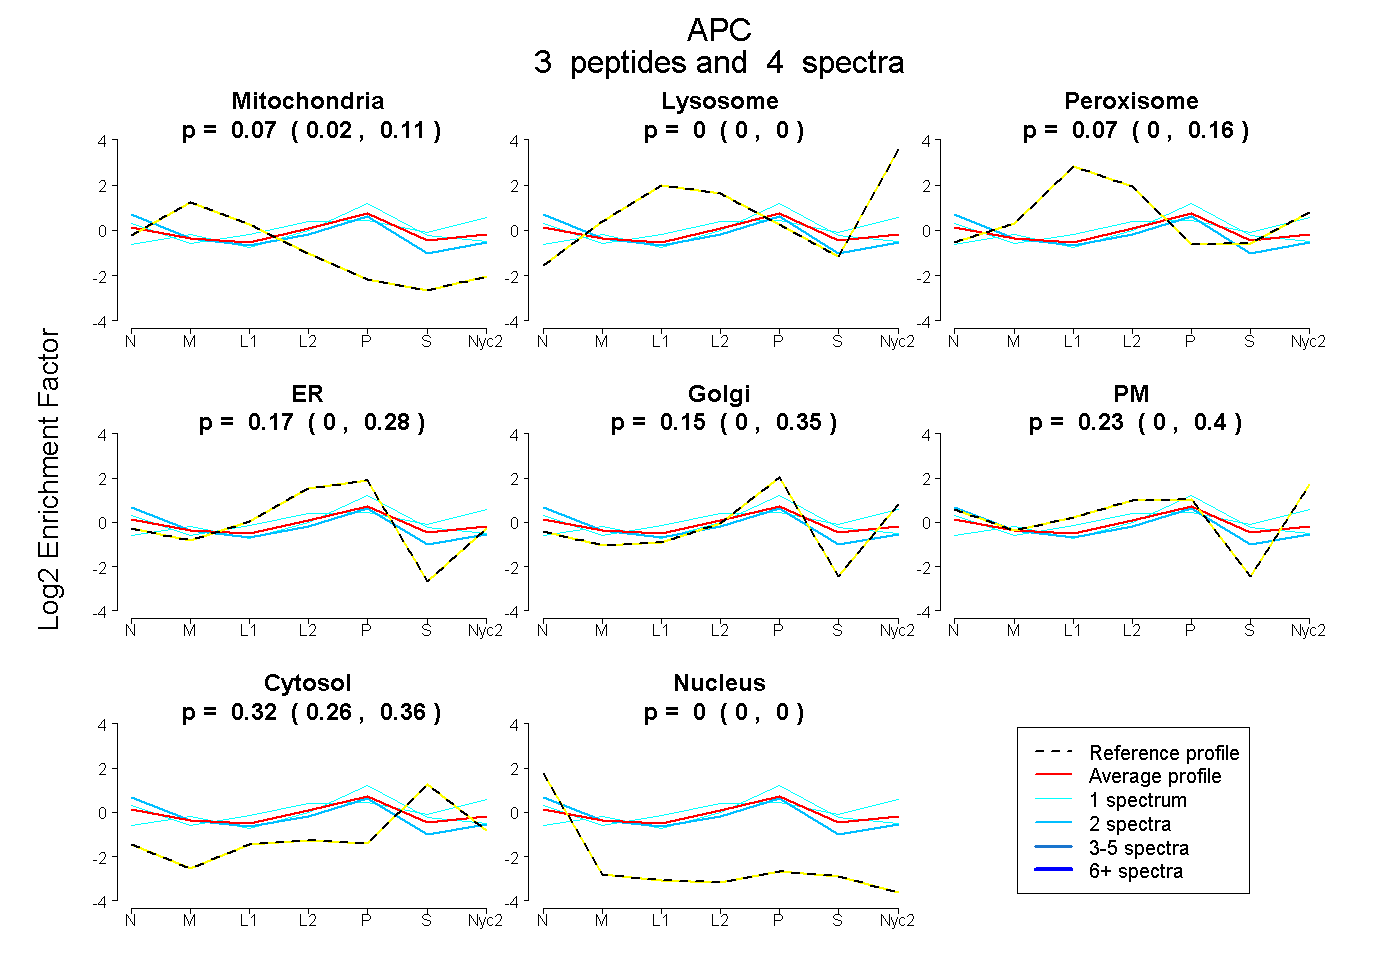
0.021 | 0.115
0.000 | 0.000
0.000 | 0.159
0.002 | 0.282
0.000 | 0.349
0.000 | 0.403
0.258 | 0.357
0.000 | 0.000
| Plot | Mito | Lyso | Perox | ER | Golgi | PM | Cytosol | Nucleus | |||||
| Expt A |
3 peptides |
4 spectra |
|
0.072 0.021 | 0.115 |
0.000 0.000 | 0.000 |
0.067 0.000 | 0.159 |
0.173 0.002 | 0.282 |
0.145 0.000 | 0.349 |
0.228 0.000 | 0.403 |
0.315 0.258 | 0.357 |
0.000 0.000 | 0.000 |
| 1 spectrum, TCSMPYAK | 0.050 | 0.000 | 0.085 | 0.238 | 0.304 | 0.000 | 0.324 | 0.000 | ||
| 1 spectrum, SPSEGPVATTSPR | 0.000 | 0.000 | 0.150 | 0.000 | 0.000 | 0.501 | 0.349 | 0.000 | ||
| 2 spectra, VLHLLEQIR | 0.125 | 0.000 | 0.000 | 0.199 | 0.069 | 0.312 | 0.214 | 0.082 |
| Plot | Lyso | Other | |||||||||||
| Expt C |
2 peptides |
2 spectra |
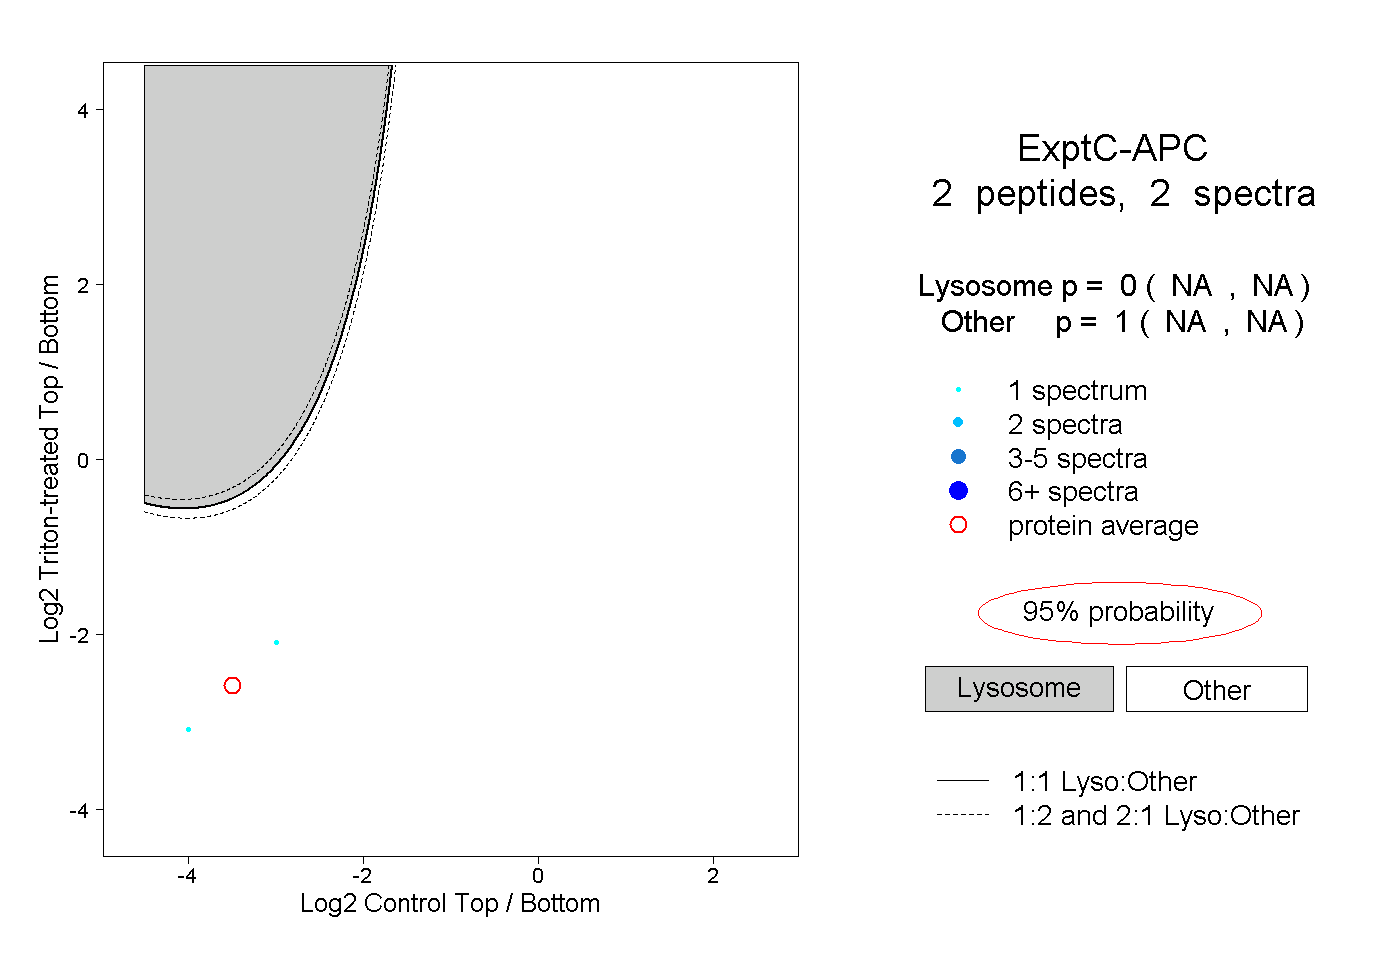 |
0.000 NA | NA |
1.000 NA | NA |
||||||||
| Plot | Lyso | Other | |||||||||||
| Expt D |
1 peptide |
1 spectrum |
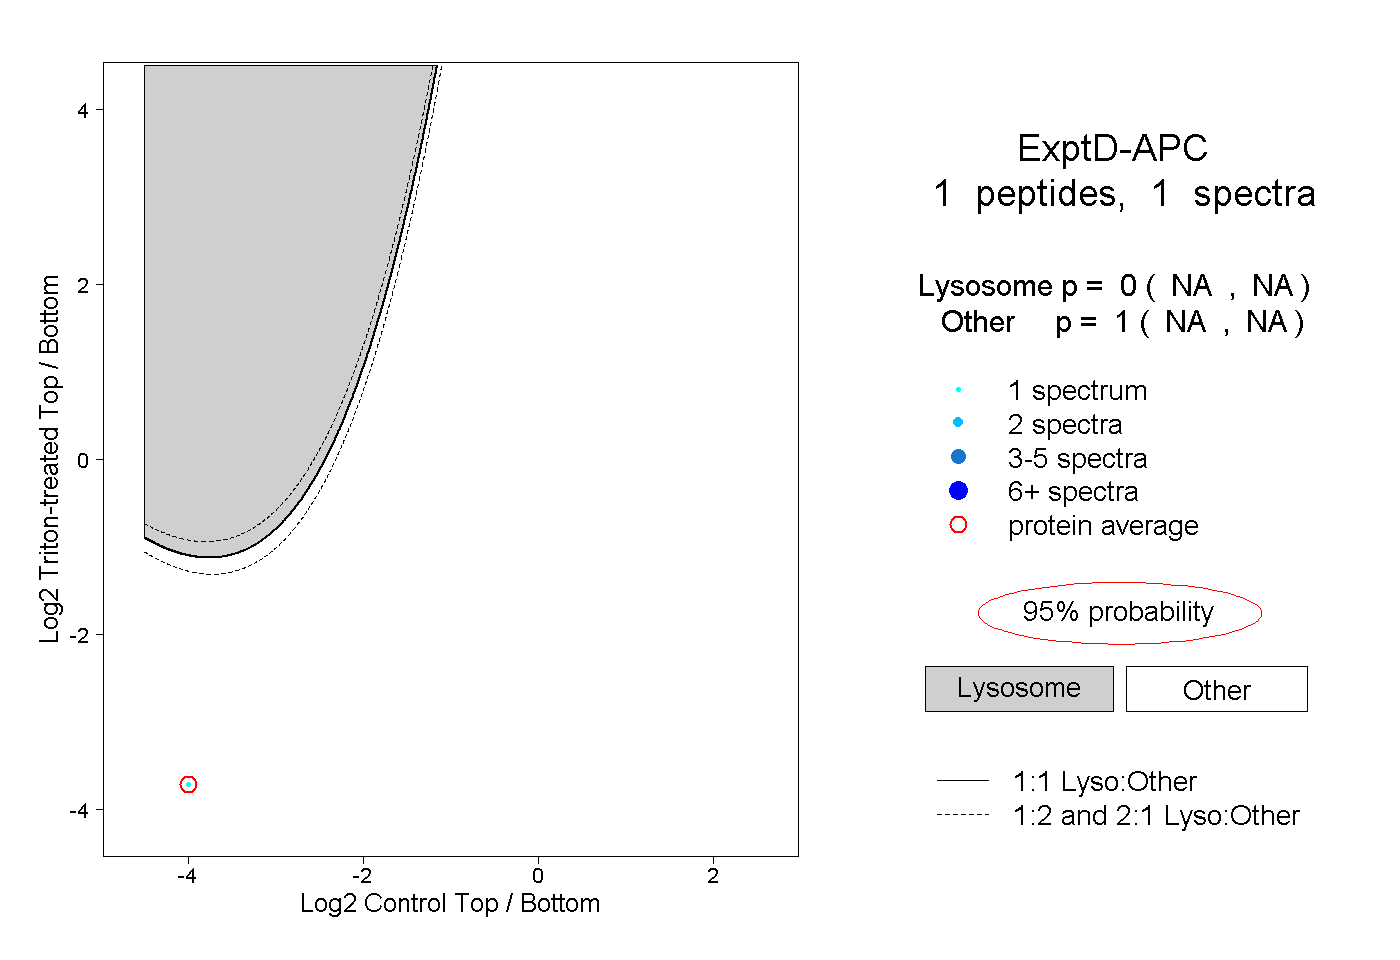 |
0.000 NA | NA |
1.000 NA | NA |