 3
3peptides
spectra
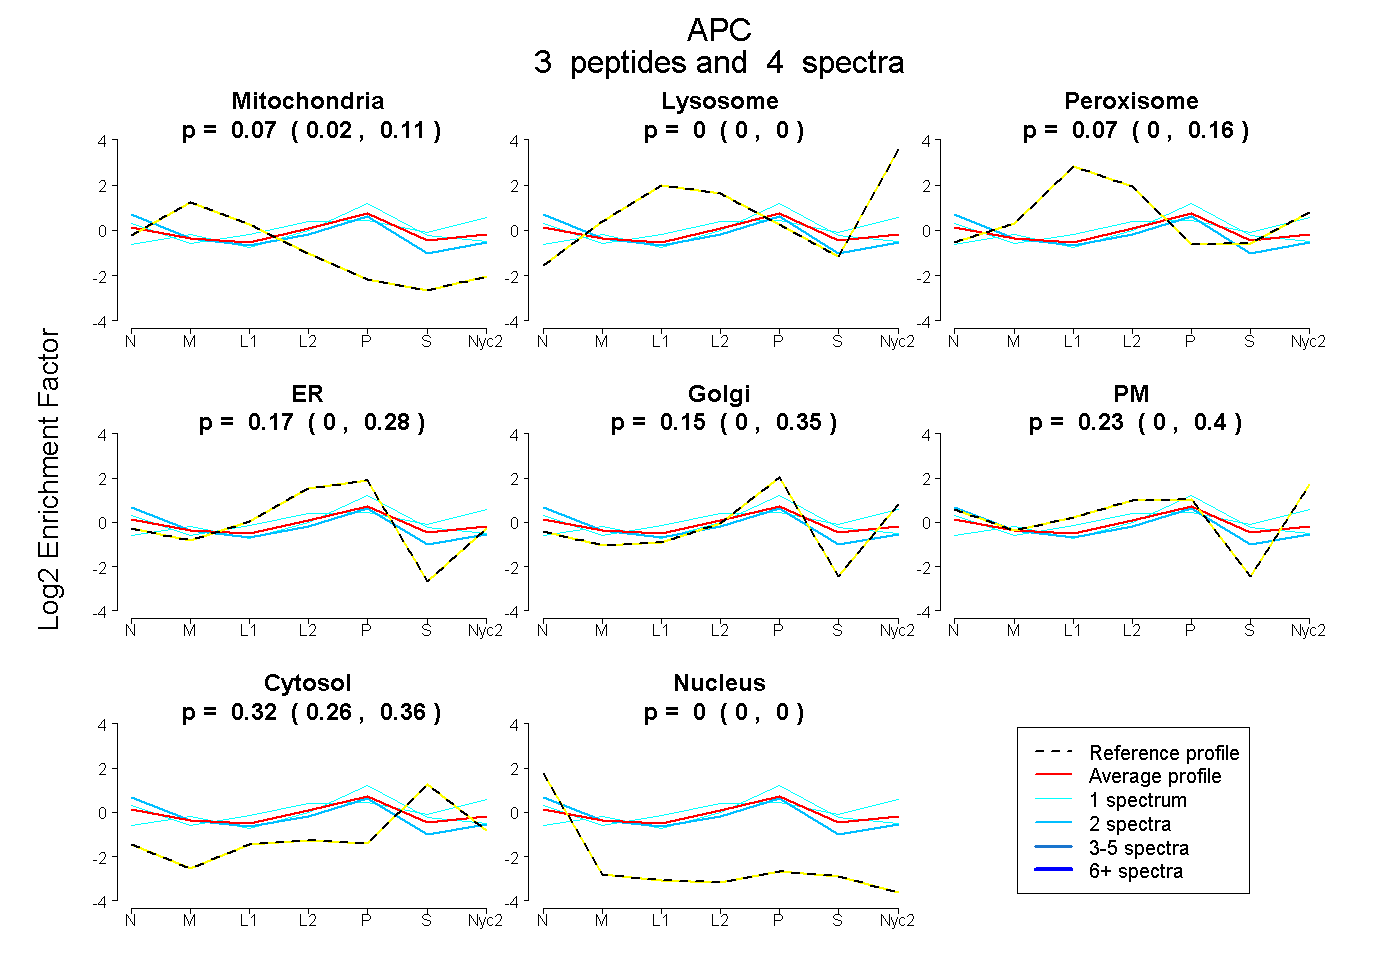
0.021 | 0.115
0.000 | 0.000
0.000 | 0.159
0.002 | 0.282
0.000 | 0.349
0.000 | 0.403
0.258 | 0.357
0.000 | 0.000
2peptides
spectra
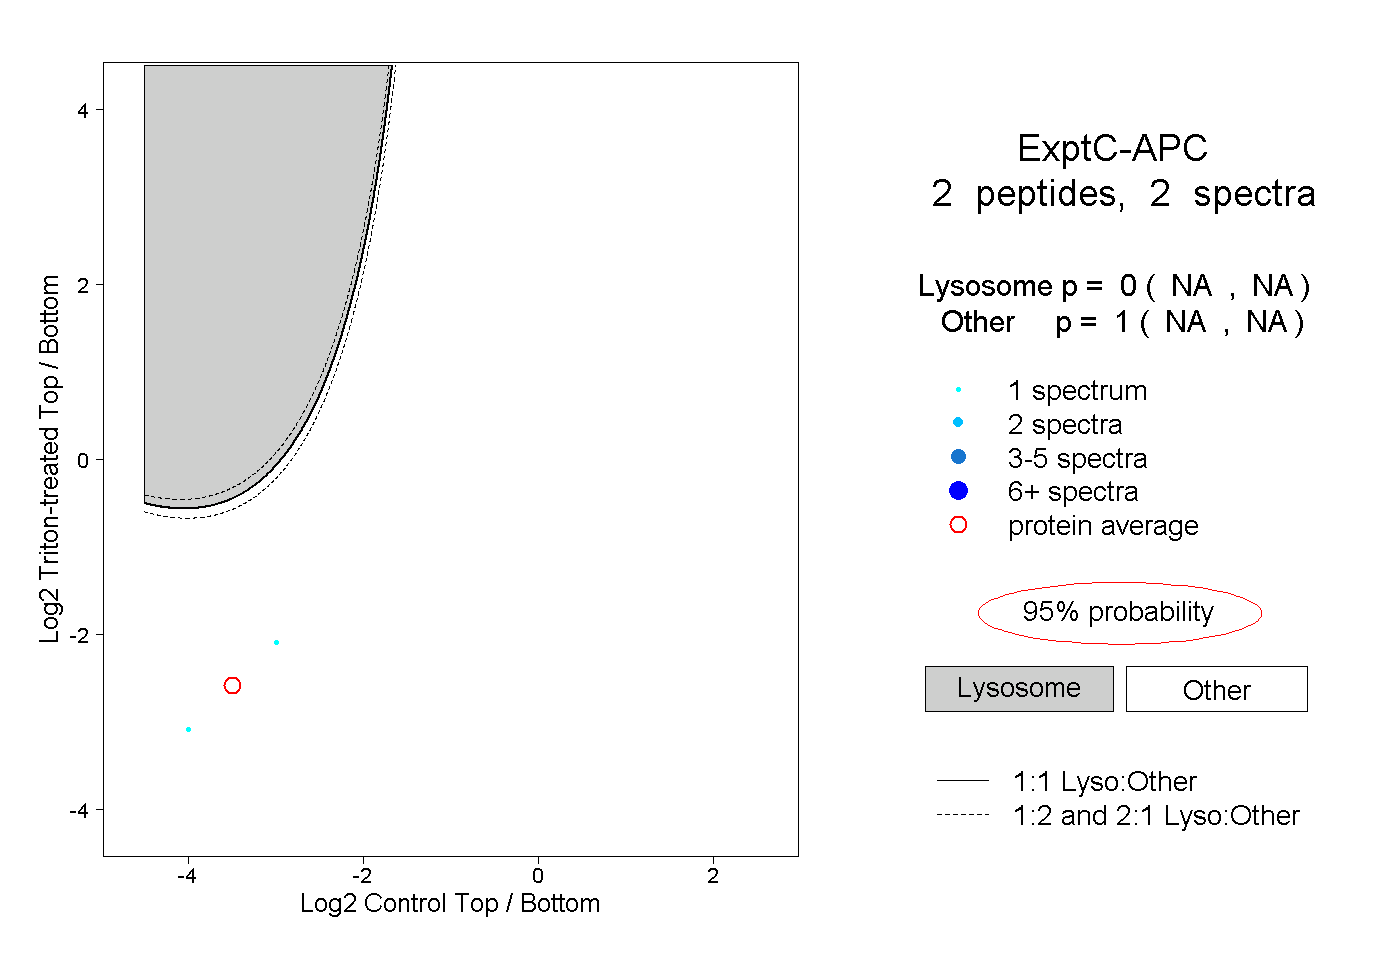
NA | NA
NA | NA
1peptide
spectrum
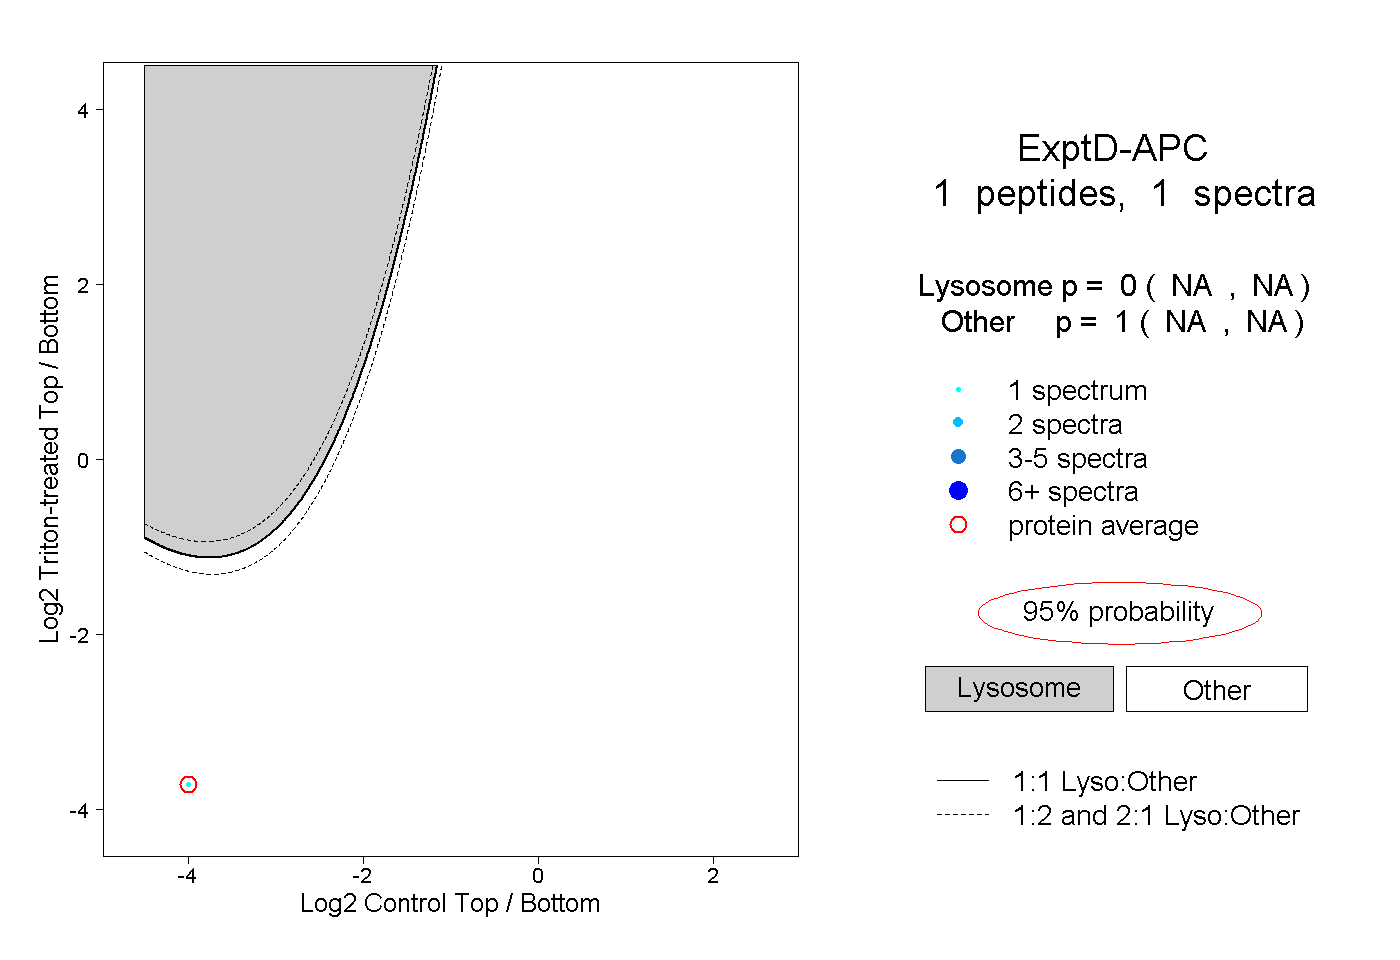
NA | NA
NA | NA