STIM1
[ENSRNOP00000027685]
Main page
| | | Plot |
Mito |
Lyso |
|
Perox |
ER |
Golgi |
PM |
Cytosol |
Nucleus |
|
| Expt A |
 10
10
peptides |
32
spectra |
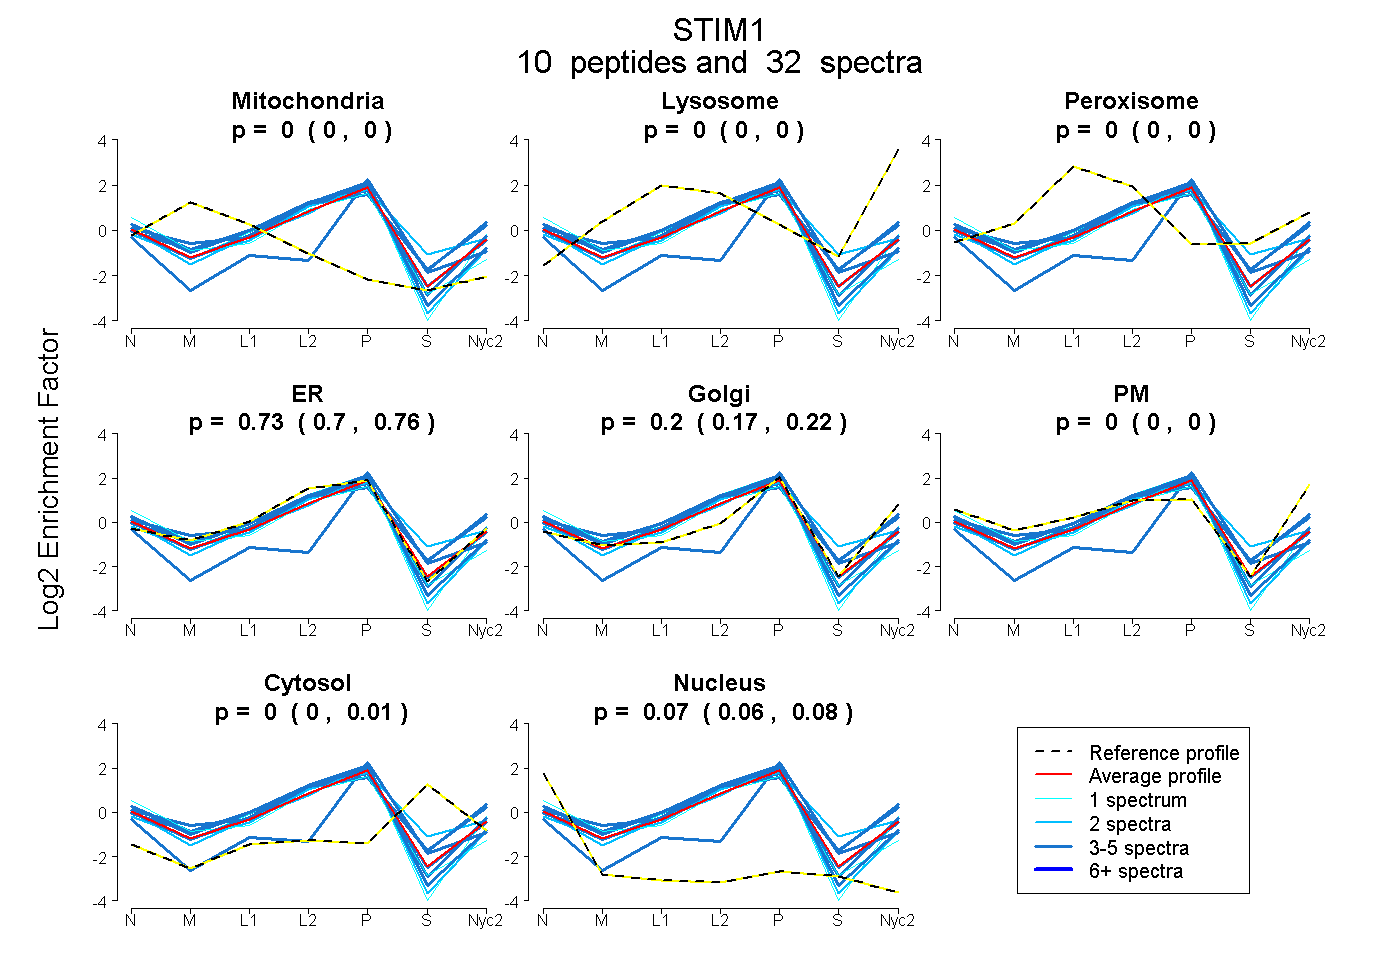 |
0.000
0.000 | 0.000 |
0.000
0.000 | 0.000 |
|
0.000
0.000 | 0.000 |
0.730
0.697 | 0.757 |
0.200
0.167 | 0.225 |
0.000
0.000 | 0.000 |
0.000
0.000 | 0.010 |
0.070
0.061 | 0.075 |
|
| | | Plot |
Mito |
|
Lyso or Perox |
|
ER |
Golgi |
PM |
Cytosol |
Nucleus |
|
| Expt B |
5
peptides |
13
spectra |
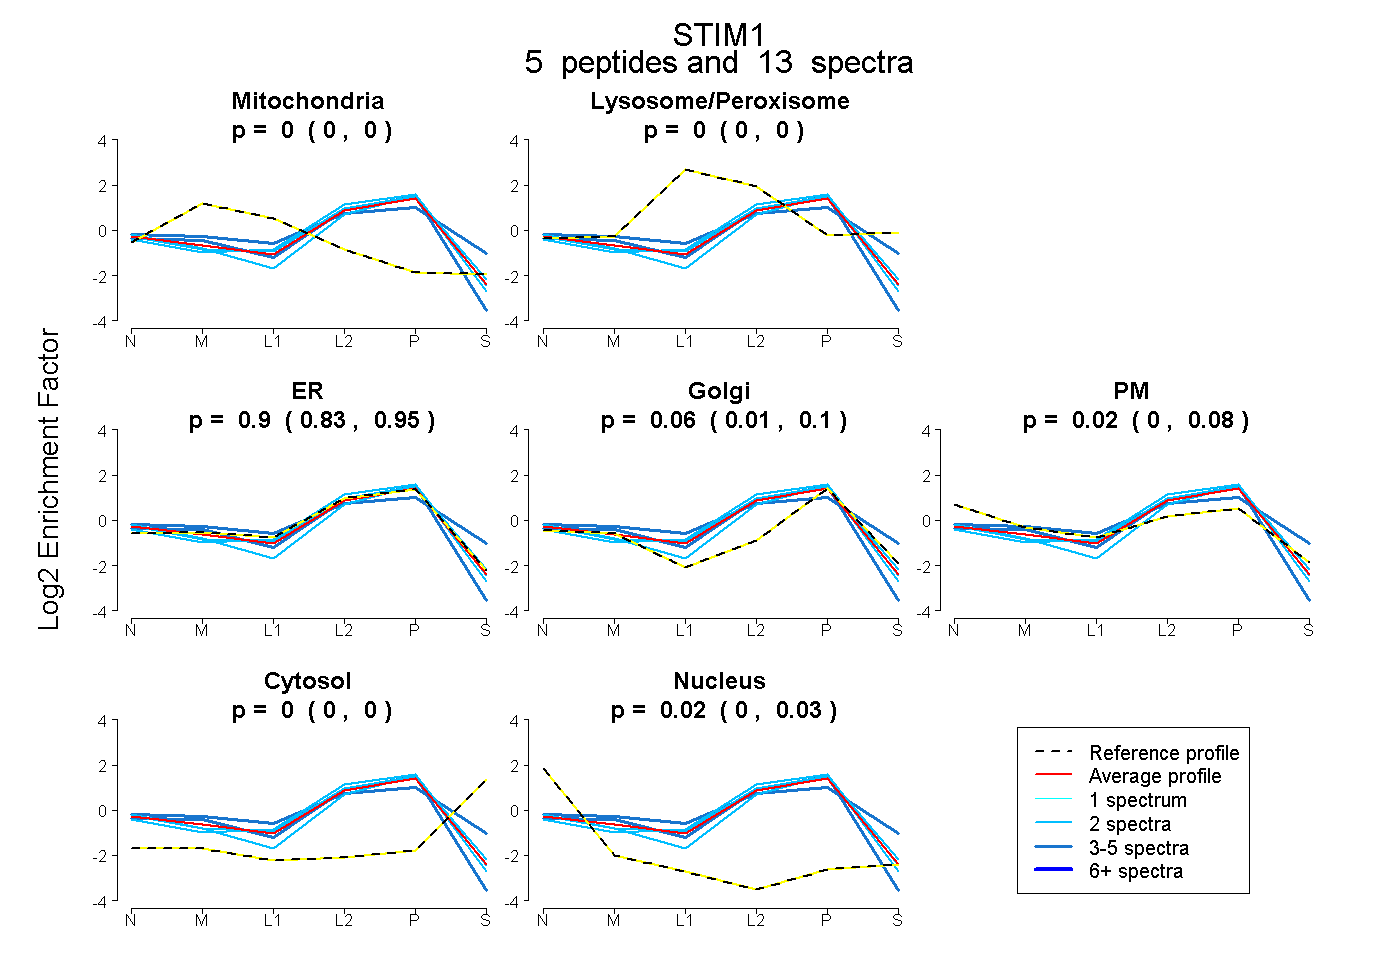 |
0.000
0.000 | 0.000 |
|
0.000
0.000 | 0.000 |
|
0.900
0.826 | 0.950 |
0.061
0.010 | 0.100 |
0.023
0.000 | 0.084 |
0.000
0.000 | 0.000 |
0.016
0.000 | 0.032 |
|
| 2 spectra, TVEVEK |
0.000 |
|
0.000 |
|
0.885 |
0.044 |
0.070 |
0.000 |
0.000 |
|
| 2 spectra, LISVEDLWK |
0.000 |
|
0.000 |
|
1.000 |
0.000 |
0.000 |
0.000 |
0.000 |
|
| 2 spectra, QALSEVTAALR |
0.000 |
|
0.000 |
|
0.710 |
0.275 |
0.000 |
0.000 |
0.015 |
|
| 4 spectra, DIEGLHR |
0.000 |
|
0.000 |
|
0.961 |
0.019 |
0.000 |
0.000 |
0.020 |
|
| 3 spectra, AEQSLHDLQER |
0.000 |
|
0.253 |
|
0.291 |
0.310 |
0.121 |
0.025 |
0.000 |
|
| | | Plot |
|
Lyso |
|
|
|
|
|
|
|
Other |
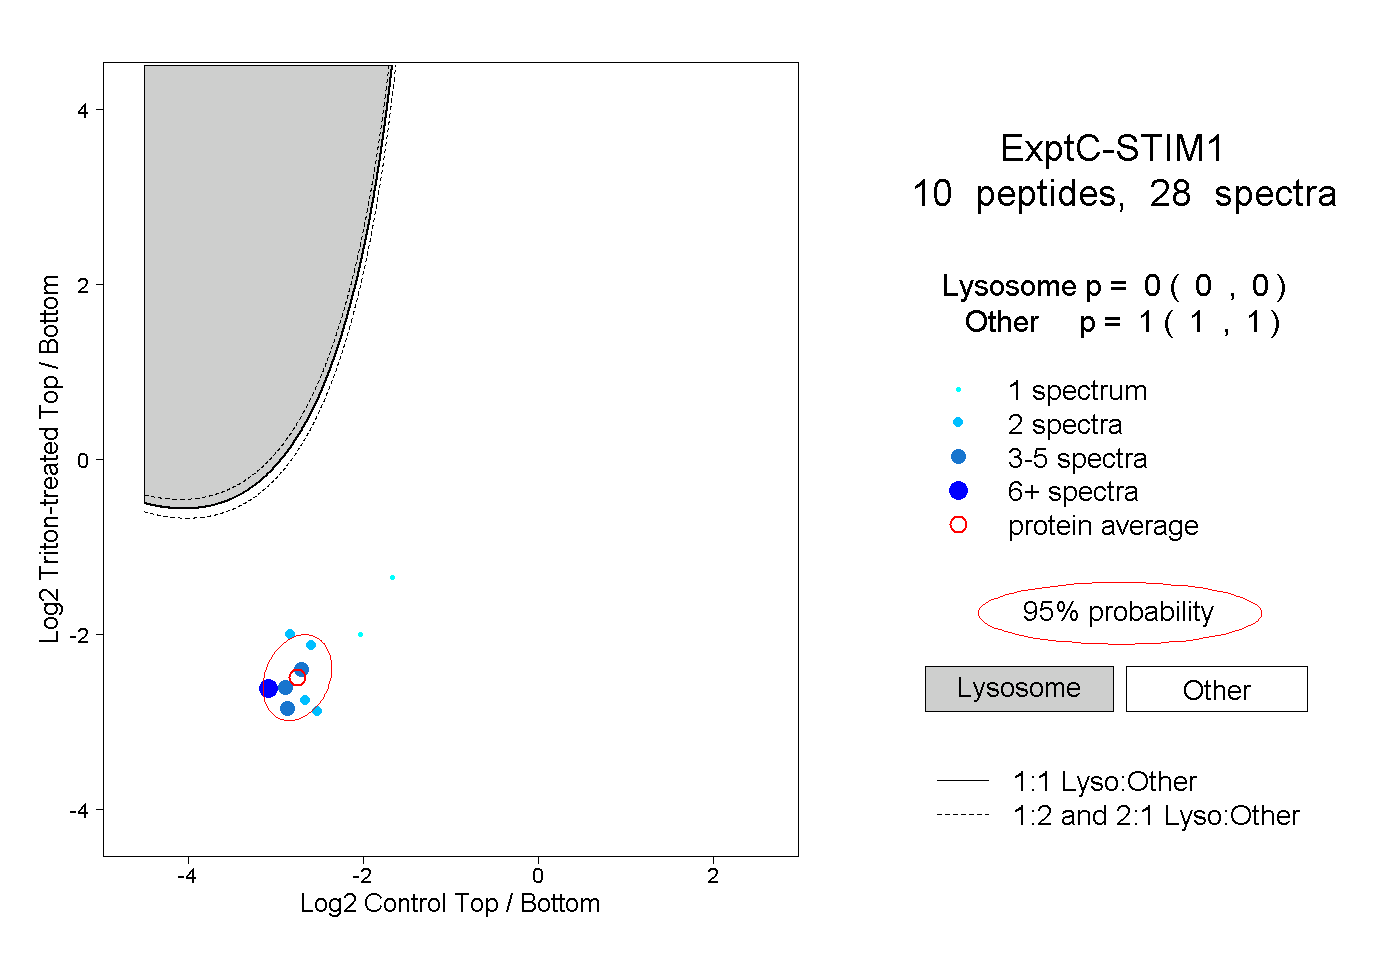
| Expt C |
10
peptides |
28
spectra |
 |
|
0.000
0.000 | 0.000 |
|
|
|
|
|
|
|
1.000
1.000 | 1.000 |
| | | Plot |
|
Lyso |
|
|
|
|
|
|
|
Other |
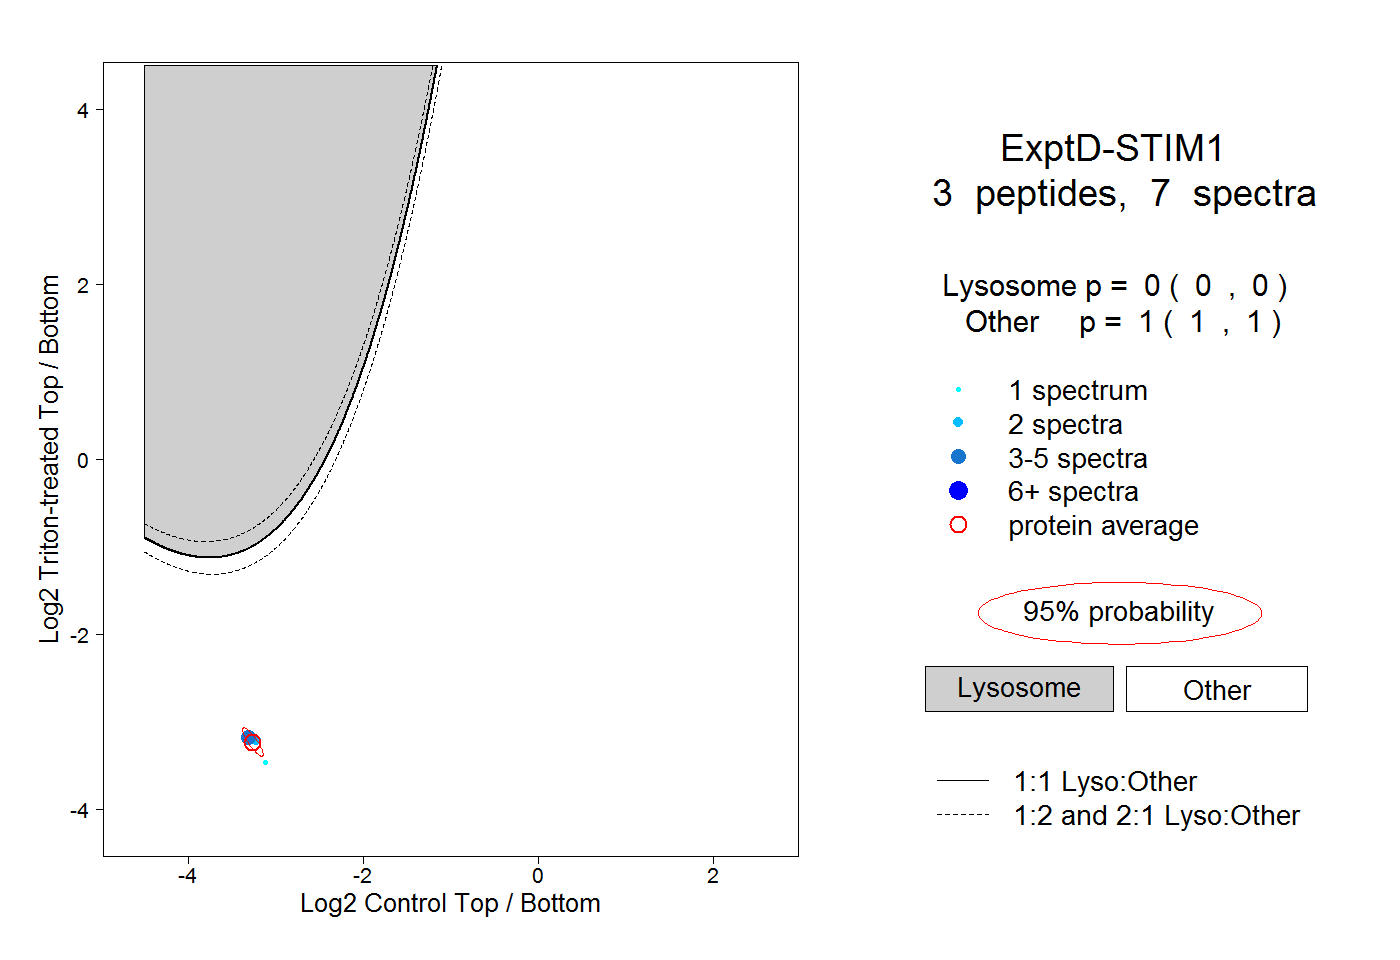
| Expt D |
3
peptides |
7
spectra |
 |
|
0.000
0.000 | 0.000 |
|
|
|
|
|
|
|
1.000
1.000 | 1.000 |