 10
10peptides
spectra
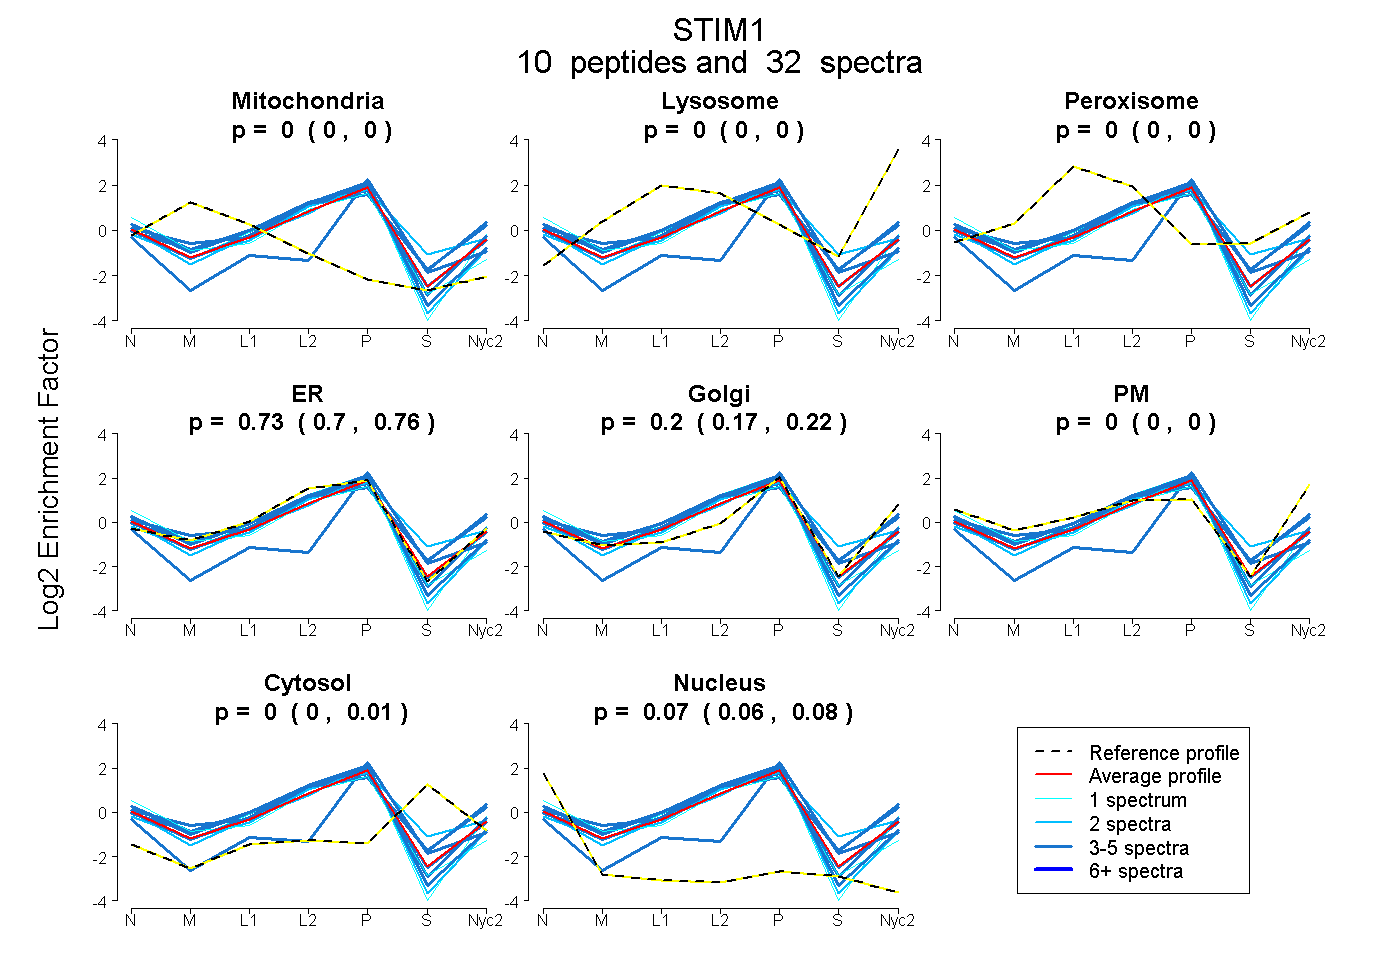
0.000 | 0.000
0.000 | 0.000
0.000 | 0.000
0.697 | 0.757
0.167 | 0.225
0.000 | 0.000
0.000 | 0.010
0.061 | 0.075
| Plot | Mito | Lyso | Perox | ER | Golgi | PM | Cytosol | Nucleus | |||||
| Expt A |
10 peptides |
32 spectra |
|
0.000 0.000 | 0.000 |
0.000 0.000 | 0.000 |
0.000 0.000 | 0.000 |
0.730 0.697 | 0.757 |
0.200 0.167 | 0.225 |
0.000 0.000 | 0.000 |
0.000 0.000 | 0.010 |
0.070 0.061 | 0.075 |
| 5 spectra, TVEVEK | 0.000 | 0.000 | 0.000 | 0.891 | 0.075 | 0.011 | 0.000 | 0.024 | ||
| 2 spectra, LISVEDLWK | 0.000 | 0.000 | 0.000 | 0.737 | 0.046 | 0.000 | 0.216 | 0.000 | ||
| 4 spectra, YAEEELEQVR | 0.000 | 0.000 | 0.000 | 0.931 | 0.000 | 0.000 | 0.000 | 0.069 | ||
| 2 spectra, QALSEVTAALR | 0.000 | 0.000 | 0.000 | 0.856 | 0.040 | 0.000 | 0.000 | 0.105 | ||
| 5 spectra, LQLTGHAMPR | 0.000 | 0.000 | 0.000 | 0.574 | 0.022 | 0.294 | 0.110 | 0.000 | ||
| 4 spectra, DIEGLHR | 0.000 | 0.000 | 0.000 | 0.866 | 0.000 | 0.071 | 0.000 | 0.063 | ||
| 1 spectrum, VHLEK | 0.000 | 0.000 | 0.000 | 0.839 | 0.000 | 0.000 | 0.000 | 0.161 | ||
| 1 spectrum, IDKPLCHSEDEK | 0.000 | 0.000 | 0.000 | 0.908 | 0.068 | 0.000 | 0.000 | 0.024 | ||
| 5 spectra, AEQSLHDLQER | 0.000 | 0.000 | 0.000 | 0.544 | 0.000 | 0.352 | 0.104 | 0.000 | ||
| 3 spectra, VAPKPPQMGR | 0.000 | 0.000 | 0.000 | 0.000 | 0.723 | 0.000 | 0.103 | 0.174 |
| Plot | Mito | Lyso or Perox | ER | Golgi | PM | Cytosol | Nucleus | ||||||
| Expt B |
5 peptides |
13 spectra |
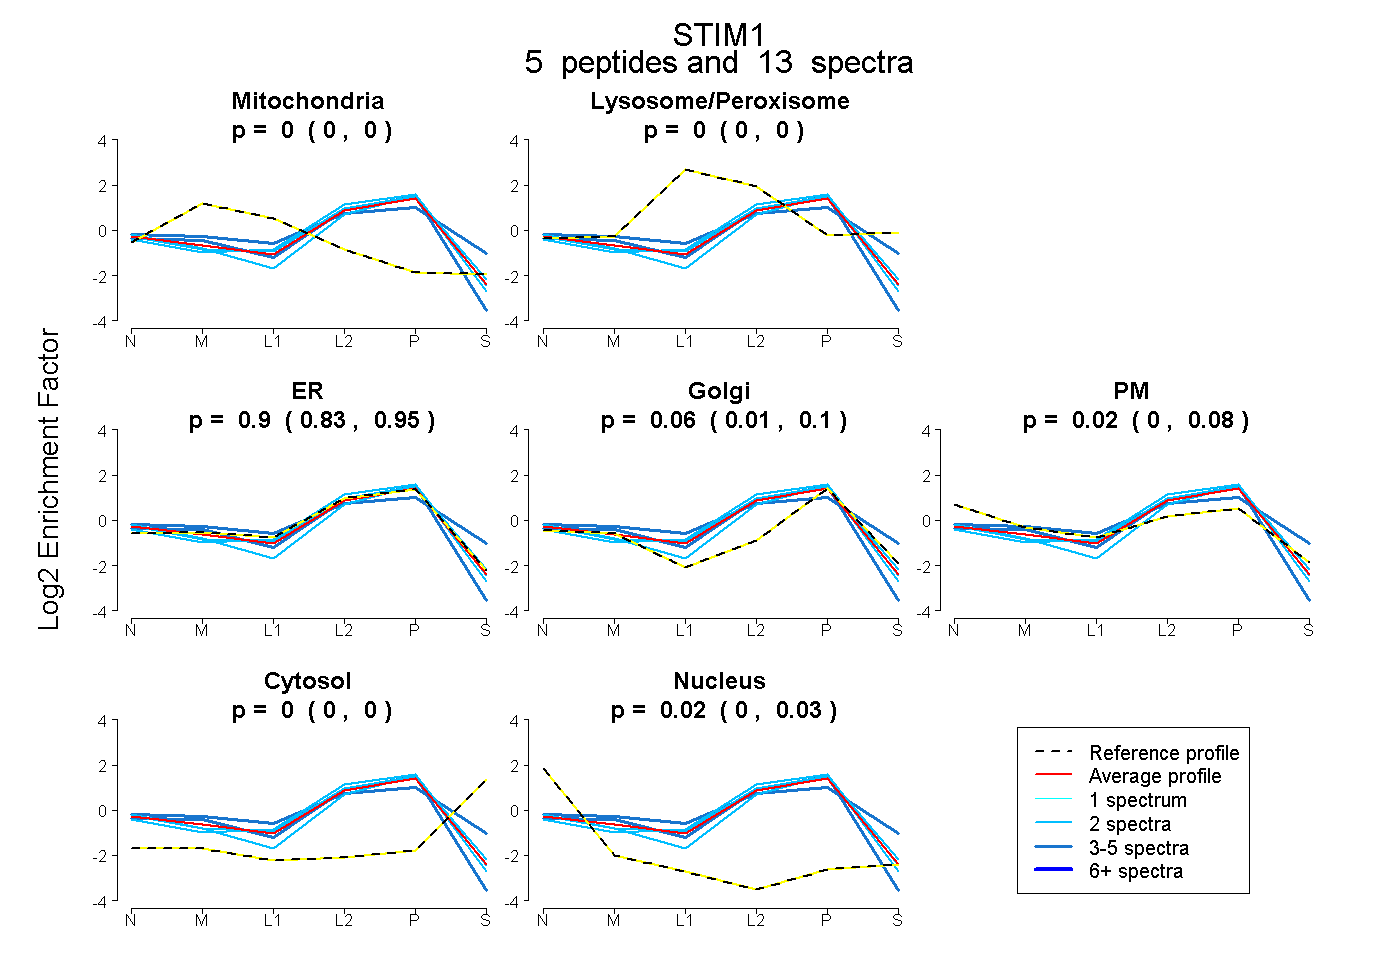 |
0.000 0.000 | 0.000 |
0.000 0.000 | 0.000 |
0.900 0.826 | 0.950 |
0.061 0.010 | 0.100 |
0.023 0.000 | 0.084 |
0.000 0.000 | 0.000 |
0.016 0.000 | 0.032 |
|||
| Plot | Lyso | Other | |||||||||||
| Expt C |
10 peptides |
28 spectra |
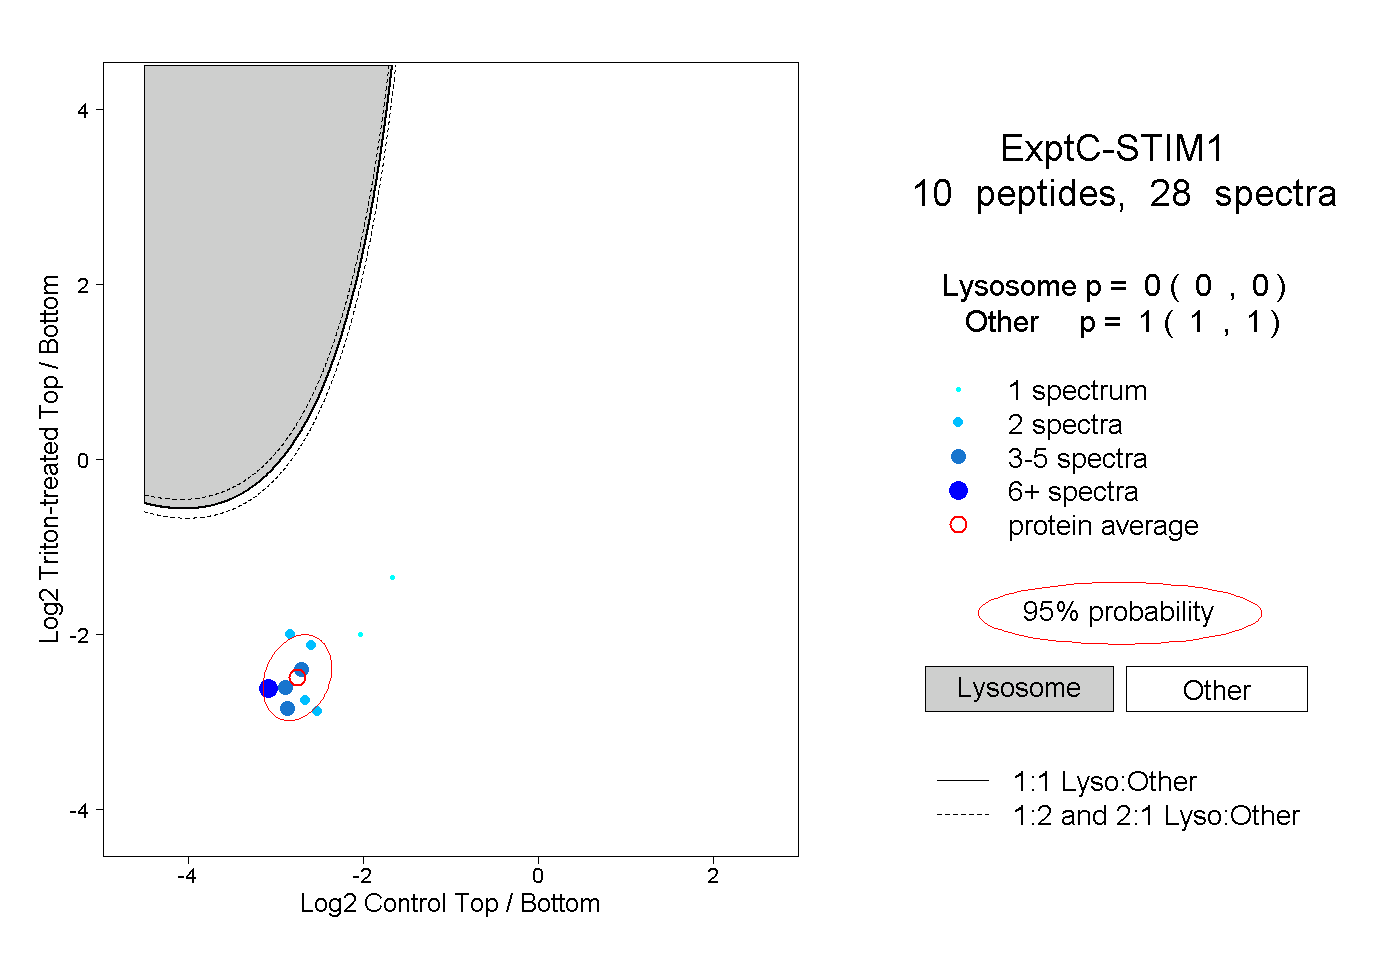 |
0.000 0.000 | 0.000 |
1.000 1.000 | 1.000 |
||||||||
| Plot | Lyso | Other | |||||||||||
| Expt D |
3 peptides |
7 spectra |
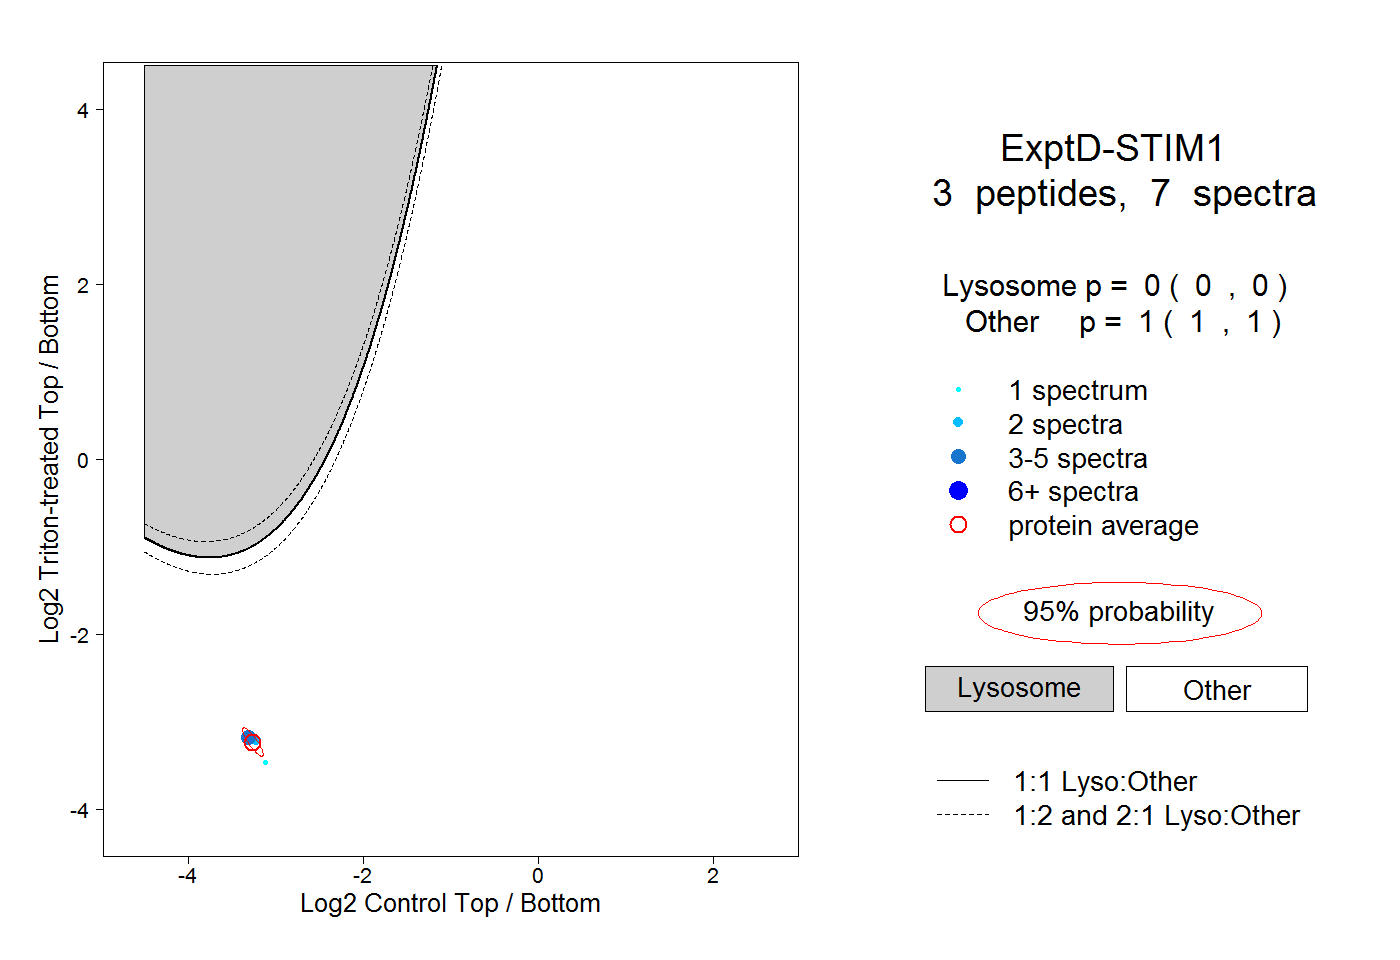 |
0.000 0.000 | 0.000 |
1.000 1.000 | 1.000 |