 17
17peptides
spectra
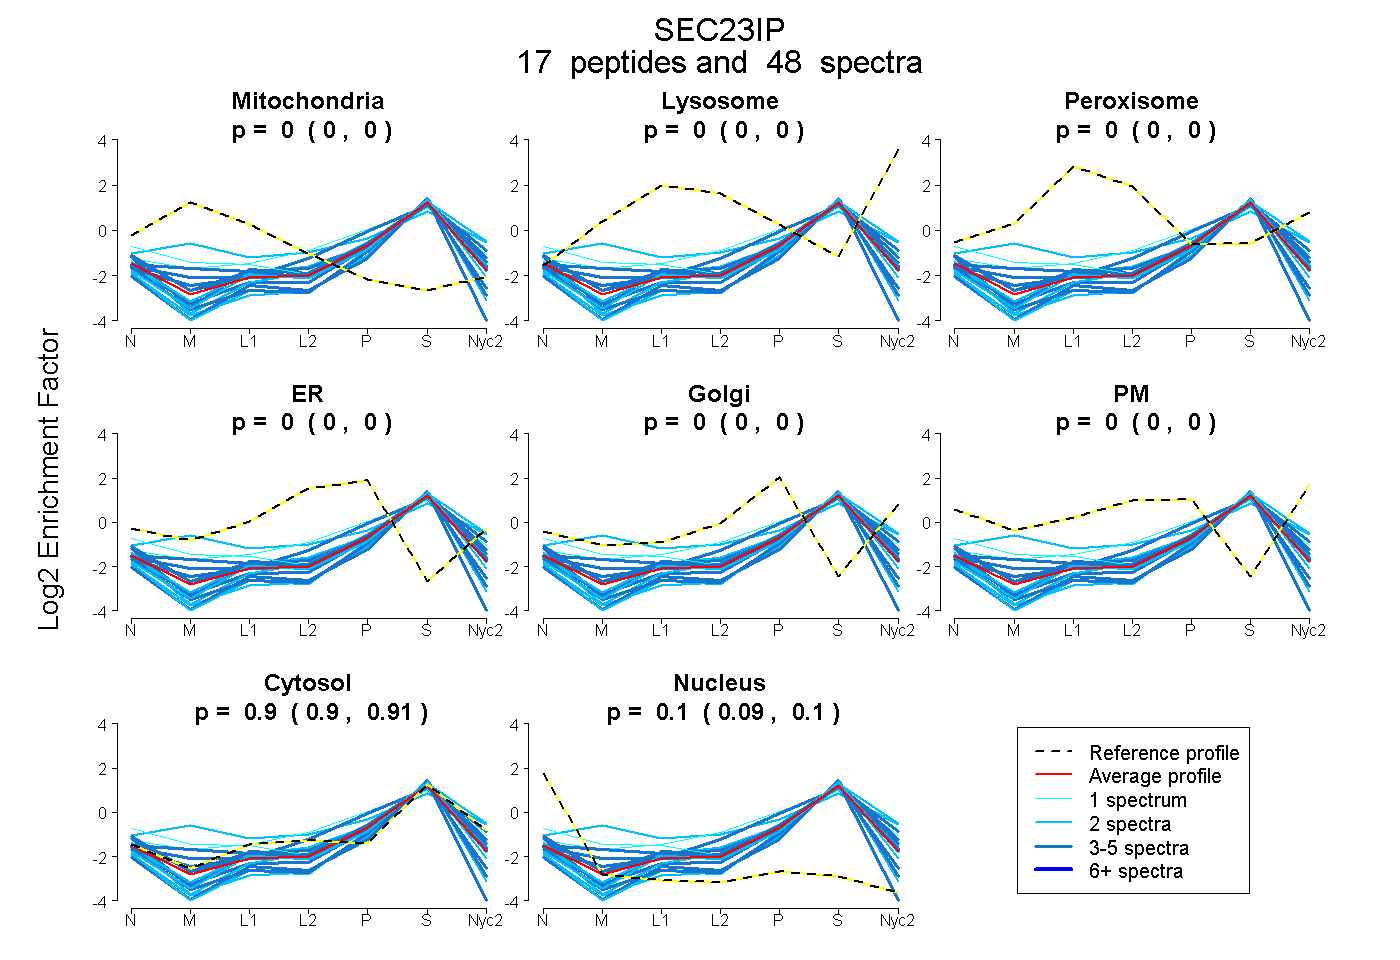
0.000 | 0.000
0.000 | 0.000
0.000 | 0.000
0.000 | 0.000
0.000 | 0.000
0.000 | 0.000
0.897 | 0.906
0.093 | 0.102
5peptides
spectra
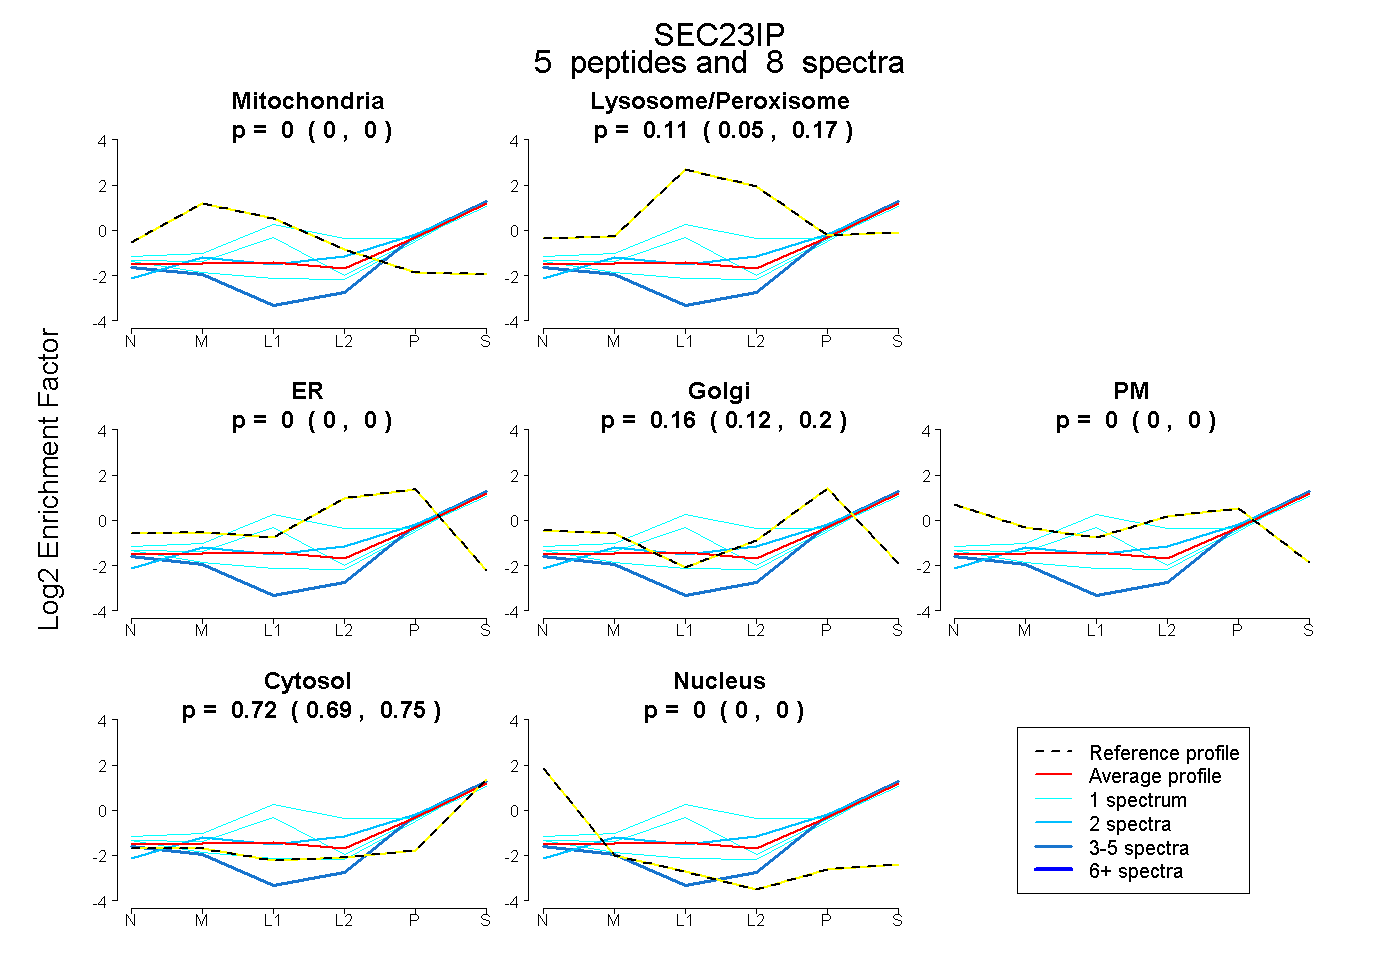
0.000 | 0.000
0.045 | 0.169
0.000 | 0.000
0.120 | 0.199
0.000 | 0.000
0.694 | 0.750
0.000 | 0.000
10peptides
spectra
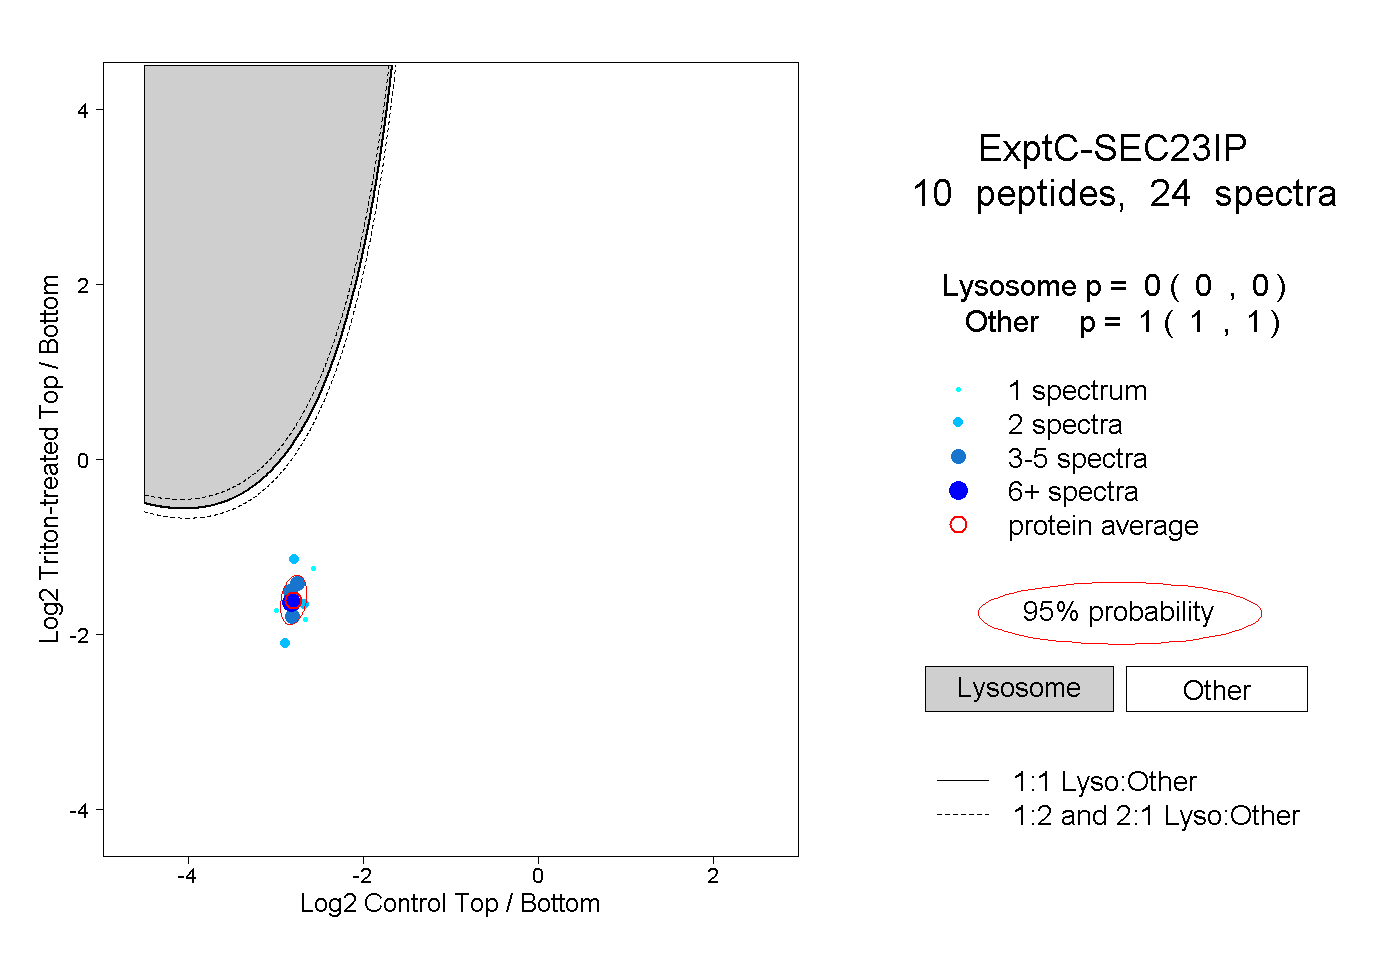
0.000 | 0.000
1.000 | 1.000