7
7peptides
spectra
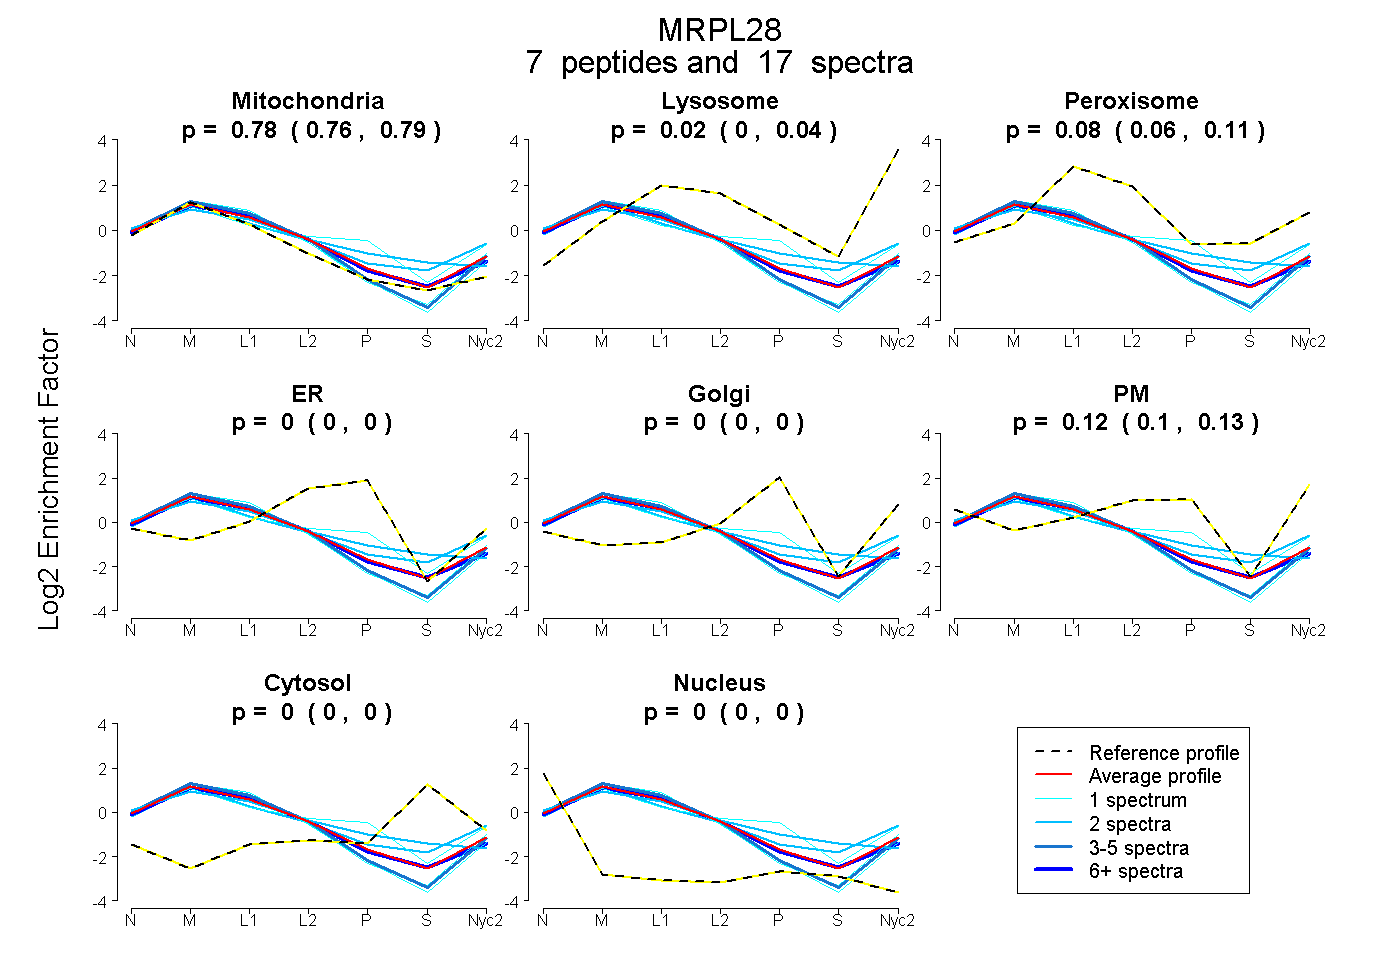
0.762 | 0.787
0.003 | 0.041
0.055 | 0.108
0.000 | 0.000
0.000 | 0.000
0.096 | 0.134
0.000 | 0.000
0.000 | 0.000
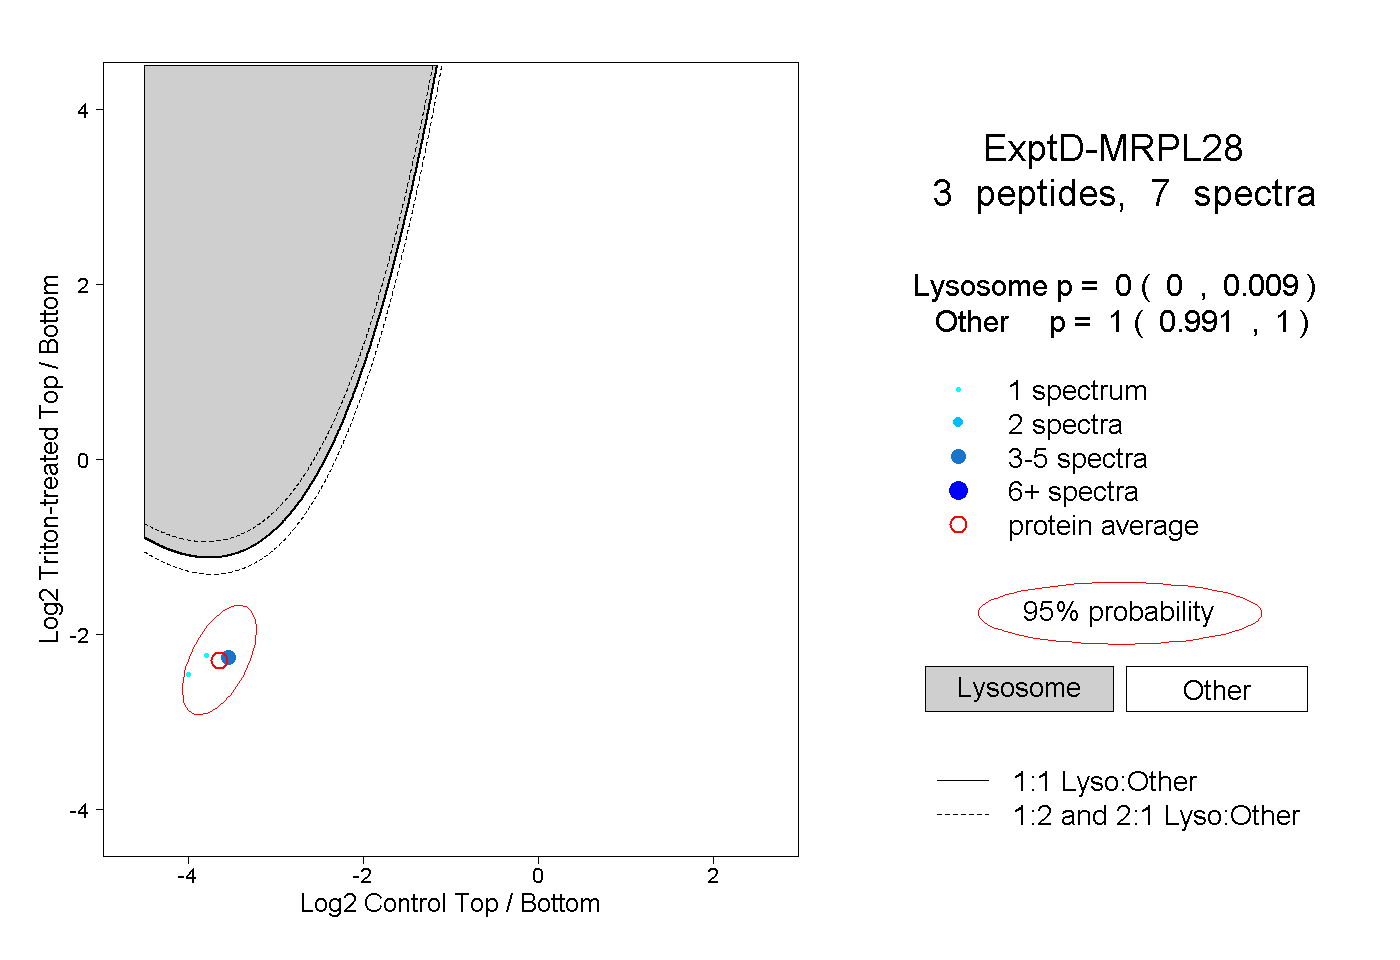
3peptides
spectra
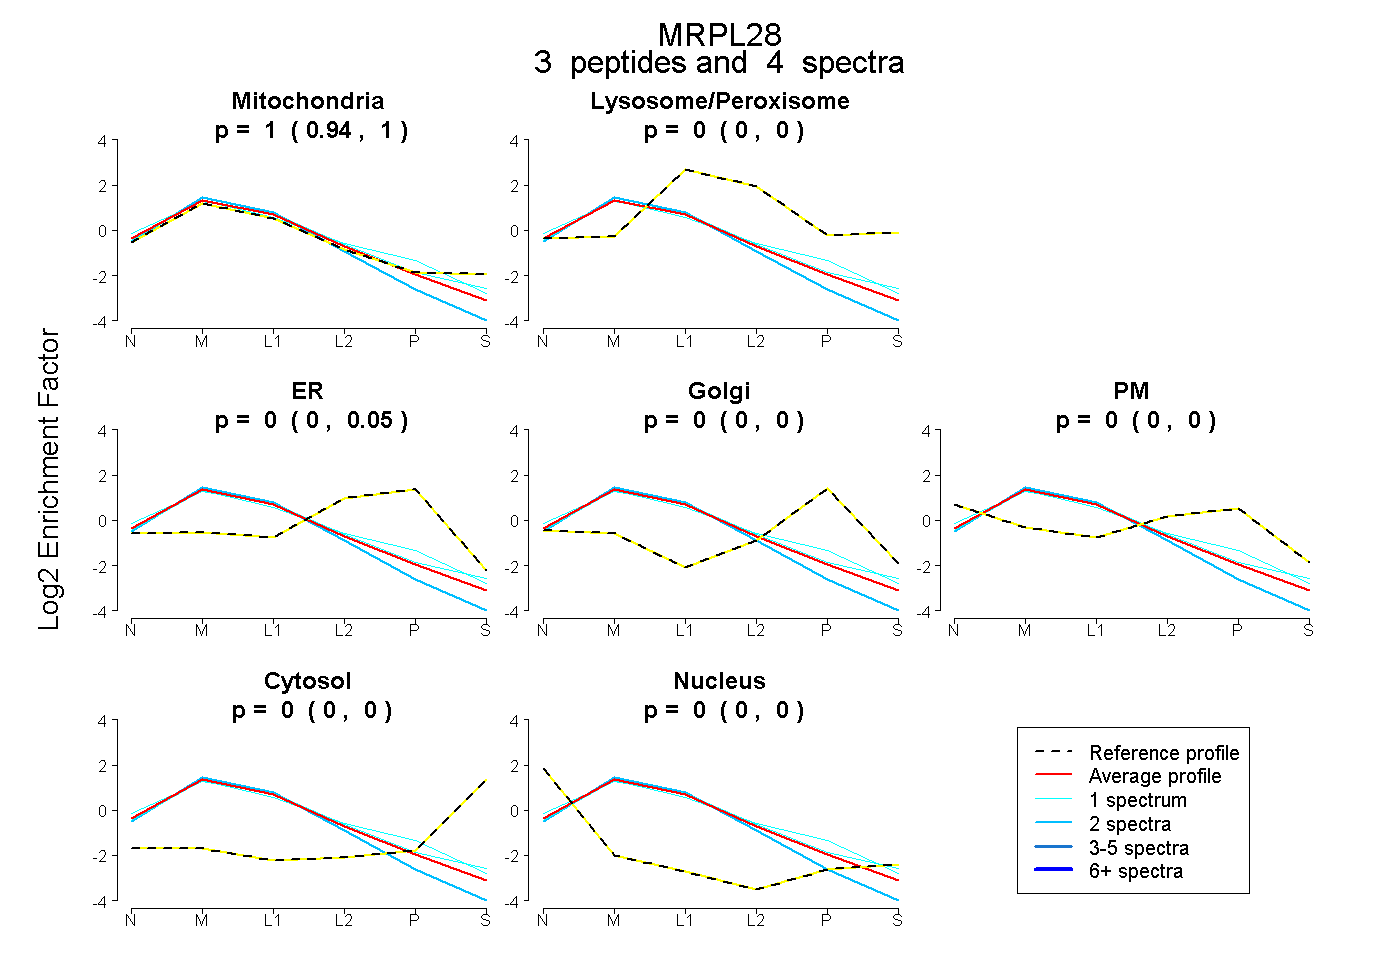
0.943 | 1.000
0.000 | 0.000
0.000 | 0.046
0.000 | 0.000
0.000 | 0.000
0.000 | 0.000
0.000 | 0.004
12peptides
spectra
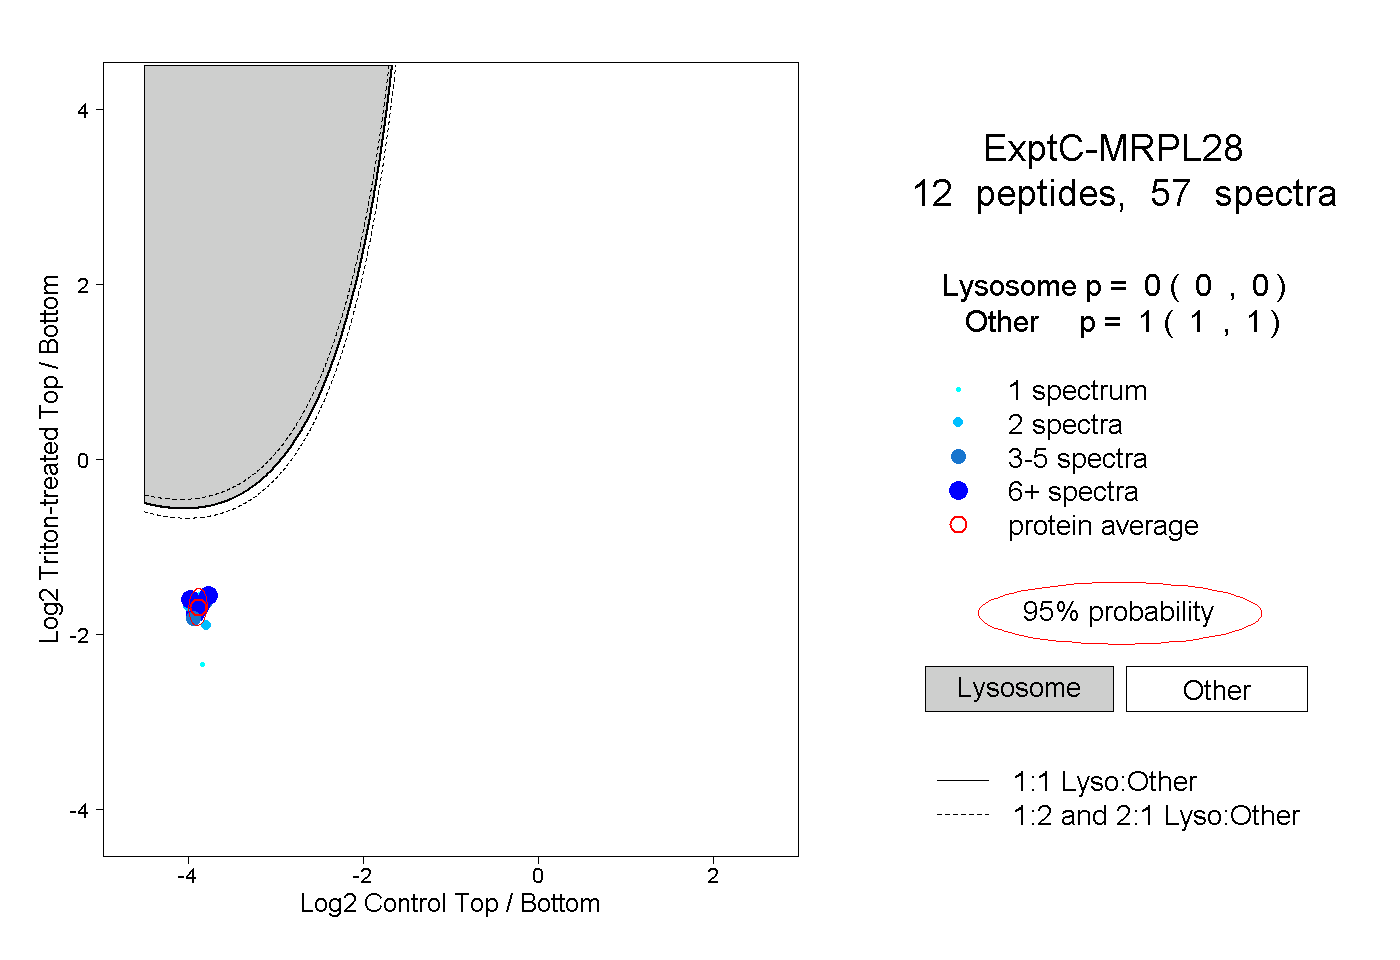
0.000 | 0.000
1.000 | 1.000