MRPL28
[ENSRNOP00000027662]
Main page
| | | Plot |
Mito |
Lyso |
|
Perox |
ER |
Golgi |
PM |
Cytosol |
Nucleus |
|
| Expt A |
 7
7
peptides |
17
spectra |
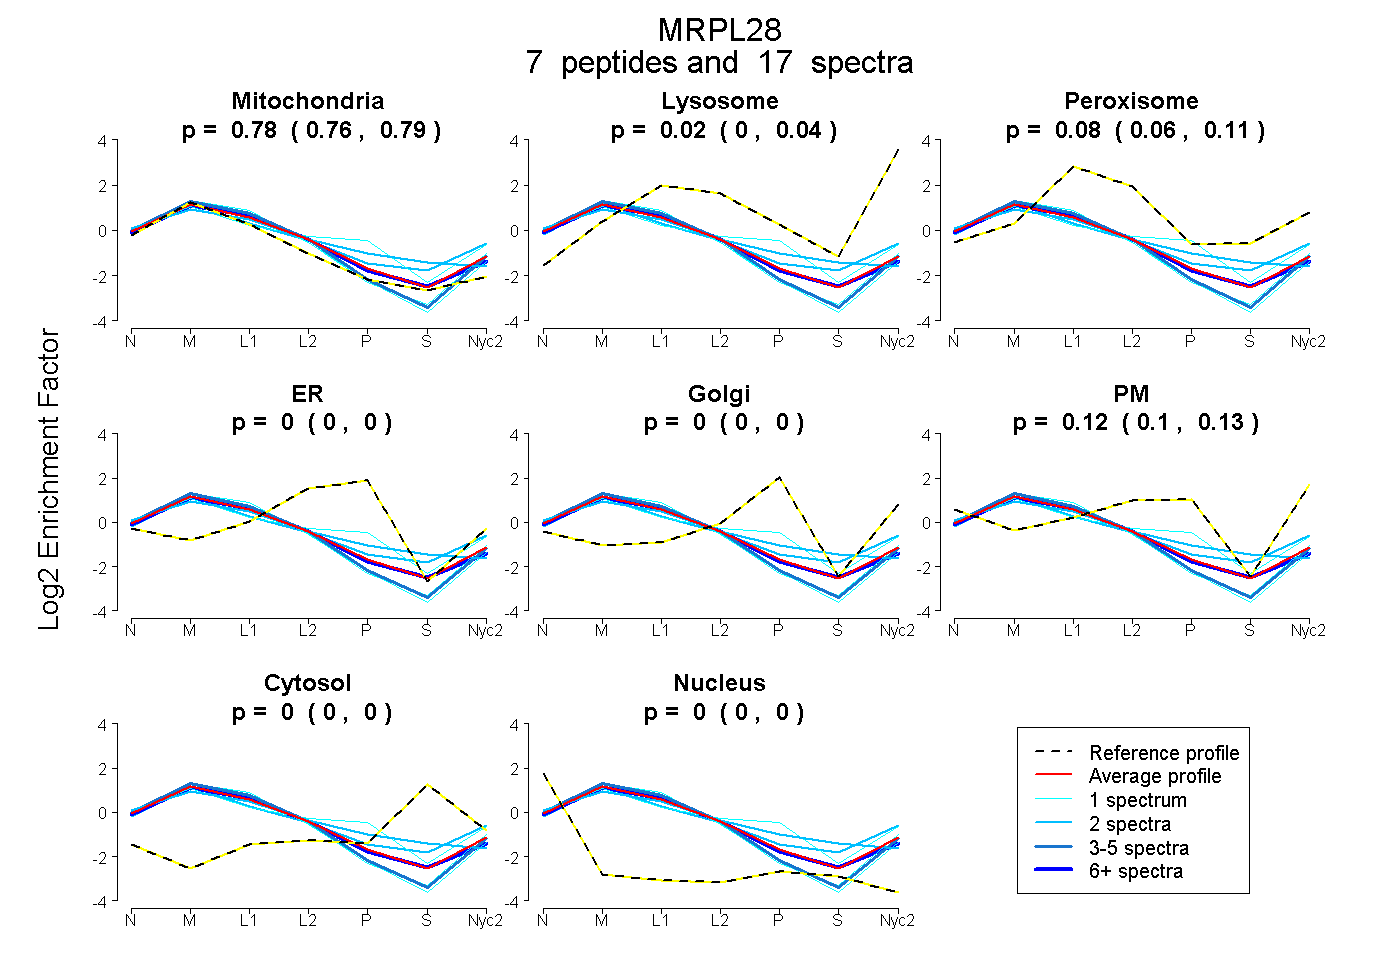 |
0.776
0.762 | 0.787 |
0.024
0.003 | 0.041 |
|
0.083
0.055 | 0.108 |
0.000
0.000 | 0.000 |
0.000
0.000 | 0.000 |
0.117
0.096 | 0.134 |
0.000
0.000 | 0.000 |
0.000
0.000 | 0.000 |
|
| | | Plot |
Mito |
|
Lyso or Perox |
|
ER |
Golgi |
PM |
Cytosol |
Nucleus |
|
| Expt B |
3
peptides |
4
spectra |
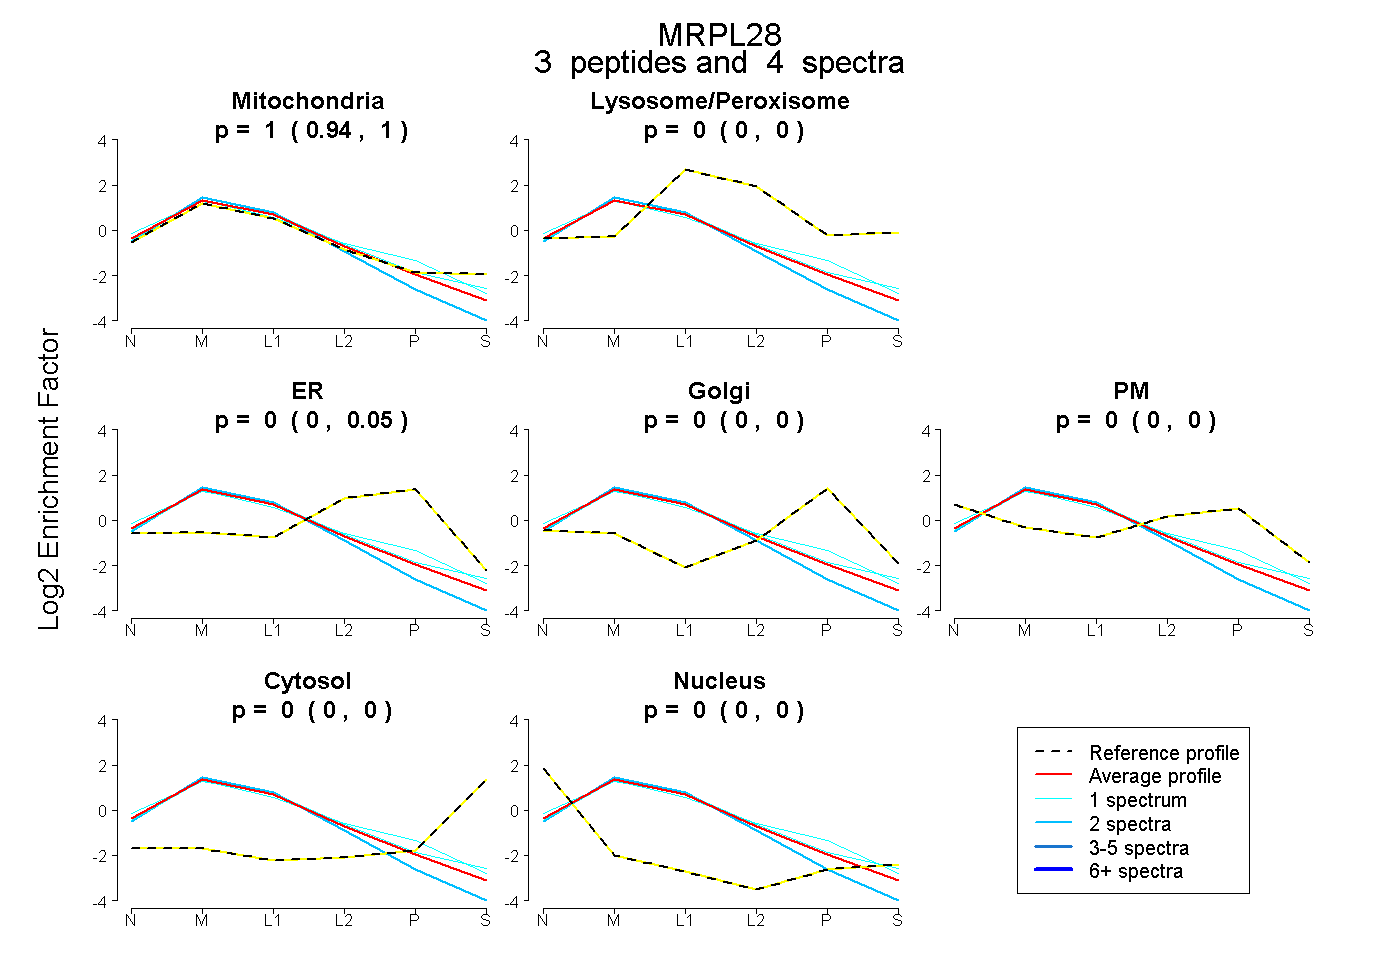 |
1.000
0.943 | 1.000 |
|
0.000
0.000 | 0.000 |
|
0.000
0.000 | 0.046 |
0.000
0.000 | 0.000 |
0.000
0.000 | 0.000 |
0.000
0.000 | 0.000 |
0.000
0.000 | 0.004 |
|
| 1 spectrum, VYVEELVQR |
0.883 |
|
0.000 |
|
0.117 |
0.000 |
0.000 |
0.000 |
0.000 |
|
| 1 spectrum, TPEEDLCSK |
0.979 |
|
0.000 |
|
0.000 |
0.000 |
0.021 |
0.000 |
0.000 |
|
| 2 spectra, LPSHFLR |
0.998 |
|
0.000 |
|
0.000 |
0.000 |
0.000 |
0.000 |
0.002 |
|
| | | Plot |
|
Lyso |
|
|
|
|
|
|
|
Other |
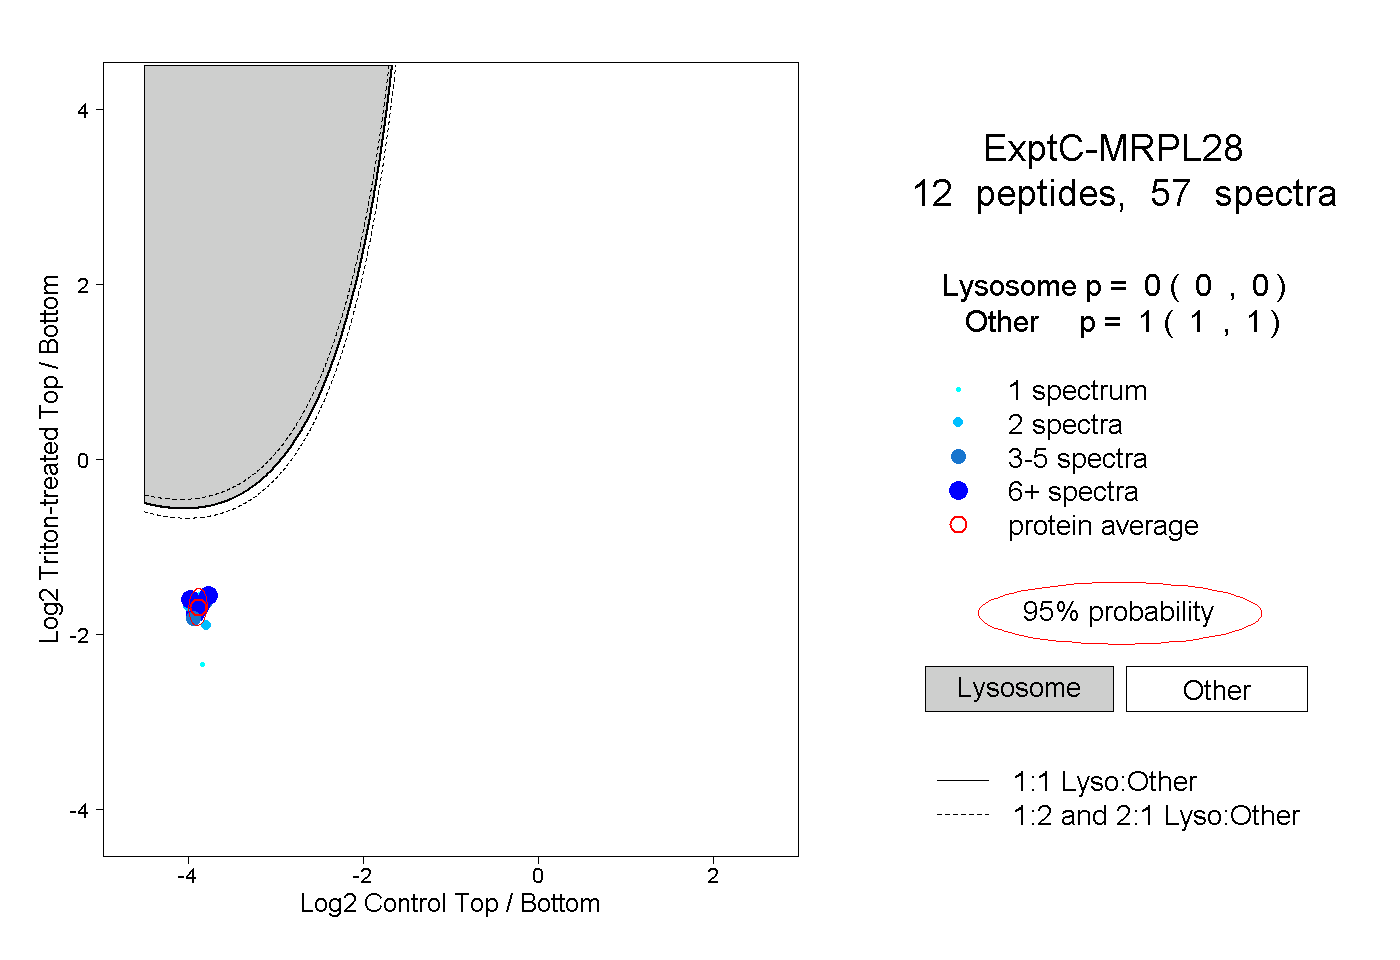
| Expt C |
12
peptides |
57
spectra |
 |
|
0.000
0.000 | 0.000 |
|
|
|
|
|
|
|
1.000
1.000 | 1.000 |
| | | Plot |
|
Lyso |
|
|
|
|
|
|
|
Other |
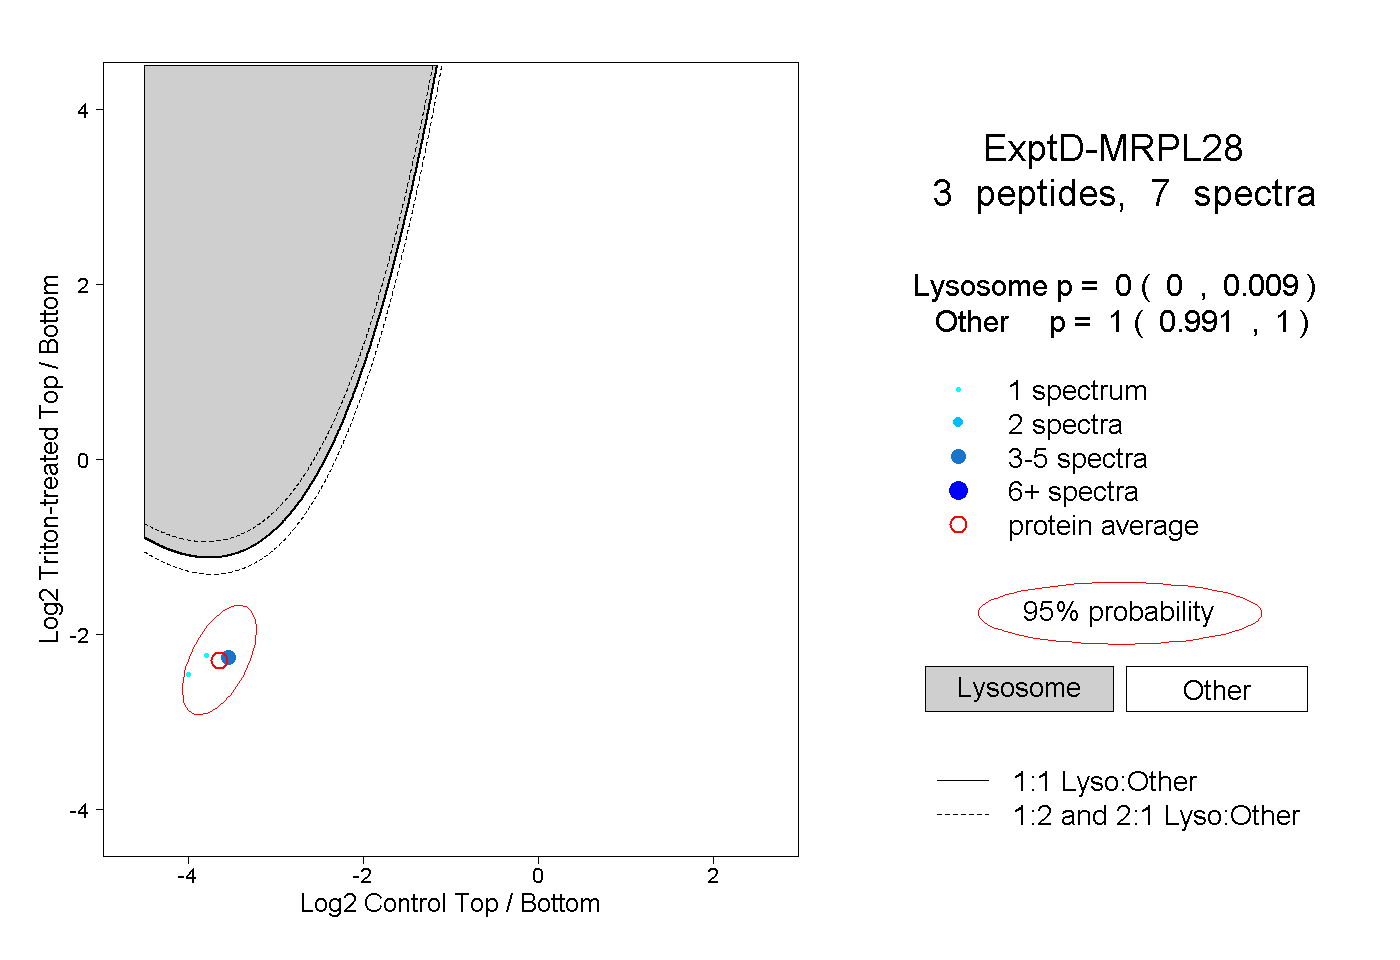
| Expt D |
3
peptides |
7
spectra |
 |
|
0.000
0.000 | 0.009 |
|
|
|
|
|
|
|
1.000
0.991 | 1.000 |