 7
7peptides
spectra
0.762 | 0.787
0.003 | 0.041
0.055 | 0.108
0.000 | 0.000
0.000 | 0.000
0.096 | 0.134
0.000 | 0.000
0.000 | 0.000
| Plot | Mito | Lyso | Perox | ER | Golgi | PM | Cytosol | Nucleus | |||||
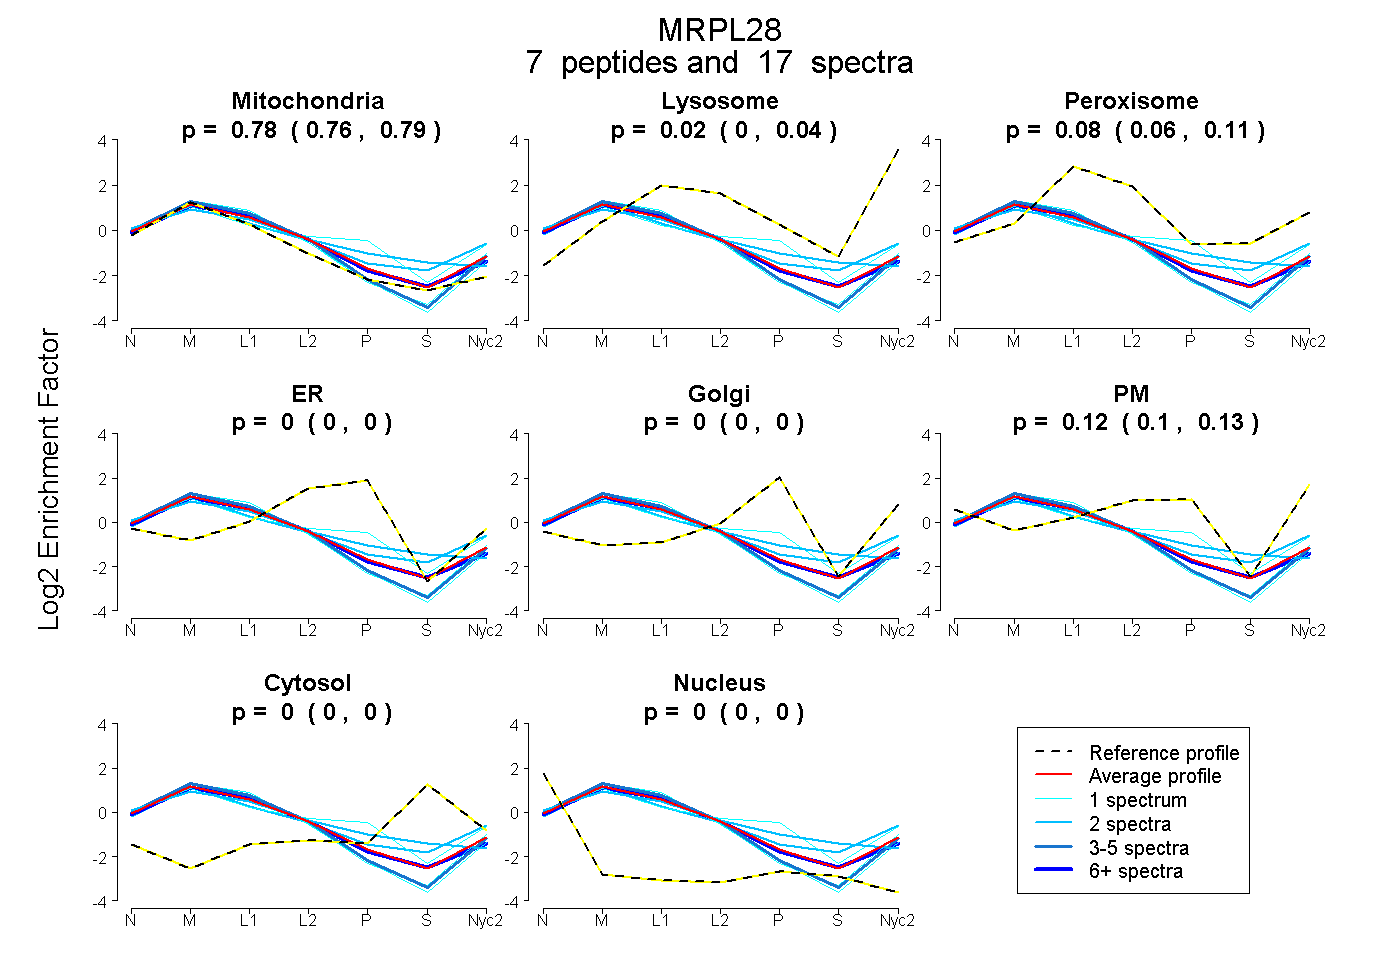
| Expt A |
7 peptides |
17 spectra |
|
0.776 0.762 | 0.787 |
0.024 0.003 | 0.041 |
0.083 0.055 | 0.108 |
0.000 0.000 | 0.000 |
0.000 0.000 | 0.000 |
0.117 0.096 | 0.134 |
0.000 0.000 | 0.000 |
0.000 0.000 | 0.000 |
| 2 spectra, VYVEELVQR | 0.644 | 0.000 | 0.161 | 0.106 | 0.000 | 0.000 | 0.089 | 0.000 | ||
| 1 spectrum, TPEEDLCSK | 0.905 | 0.050 | 0.000 | 0.000 | 0.000 | 0.045 | 0.000 | 0.000 | ||
| 2 spectra, FTVTVTMR | 0.692 | 0.182 | 0.000 | 0.000 | 0.000 | 0.073 | 0.053 | 0.000 | ||
| 1 spectrum, SIEEER | 0.870 | 0.091 | 0.000 | 0.000 | 0.000 | 0.039 | 0.000 | 0.000 | ||
| 7 spectra, LPSHFLR | 0.797 | 0.000 | 0.129 | 0.000 | 0.000 | 0.074 | 0.000 | 0.000 | ||
| 3 spectra, VWKPQLFTR | 0.866 | 0.072 | 0.000 | 0.000 | 0.000 | 0.062 | 0.000 | 0.000 | ||
| 1 spectrum, QDPQLHPDNPER | 0.589 | 0.041 | 0.009 | 0.040 | 0.080 | 0.241 | 0.000 | 0.000 |
| Plot | Mito | Lyso or Perox | ER | Golgi | PM | Cytosol | Nucleus | ||||||
| Expt B |
3 peptides |
4 spectra |
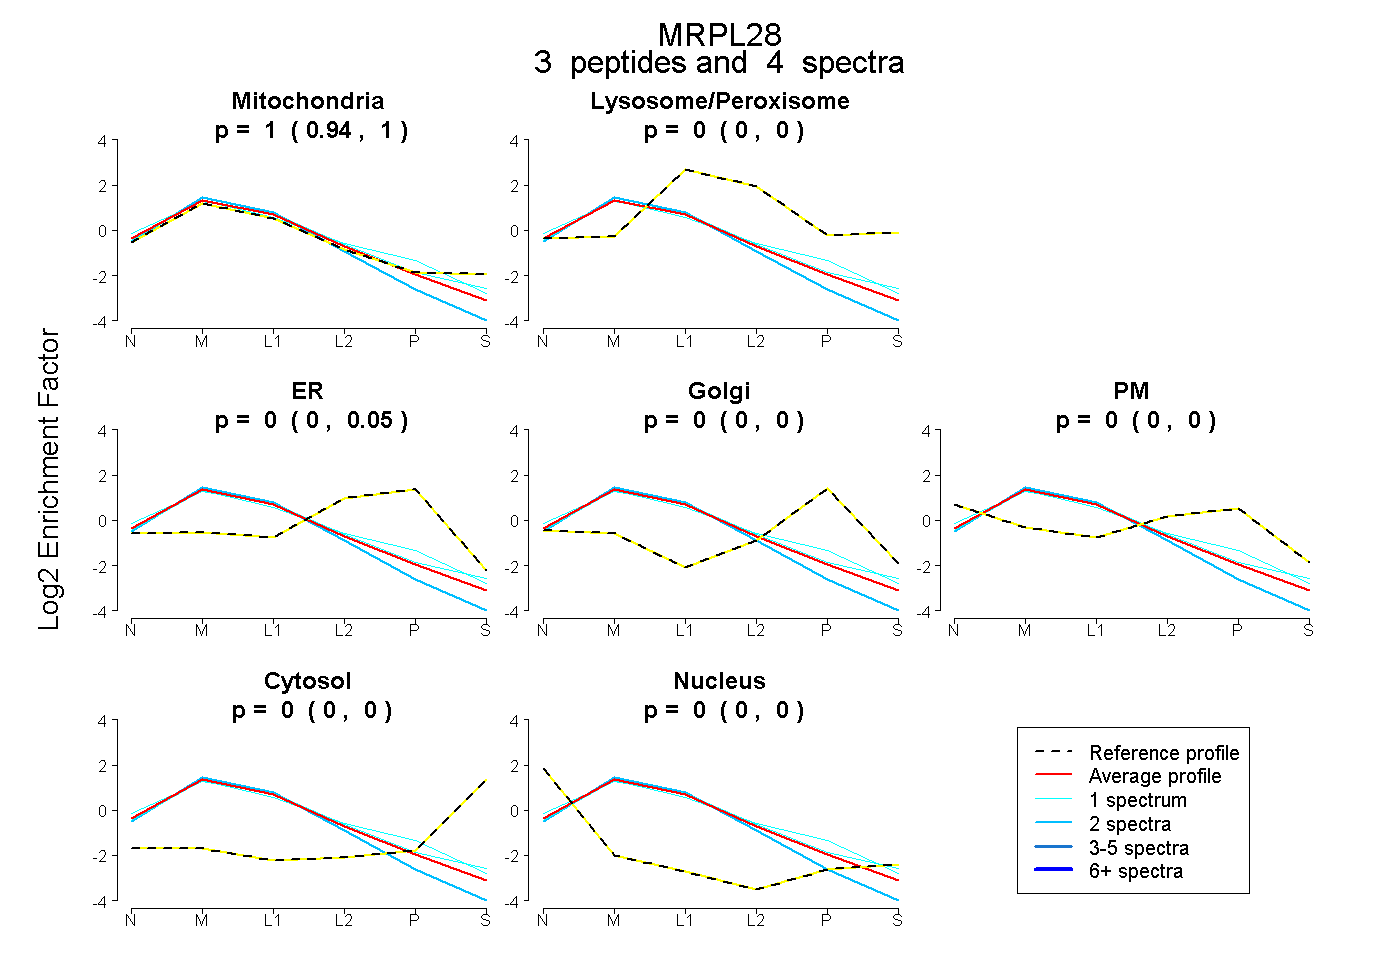 |
1.000 0.943 | 1.000 |
0.000 0.000 | 0.000 |
0.000 0.000 | 0.046 |
0.000 0.000 | 0.000 |
0.000 0.000 | 0.000 |
0.000 0.000 | 0.000 |
0.000 0.000 | 0.004 |
|||
| Plot | Lyso | Other | |||||||||||
| Expt C |
12 peptides |
57 spectra |
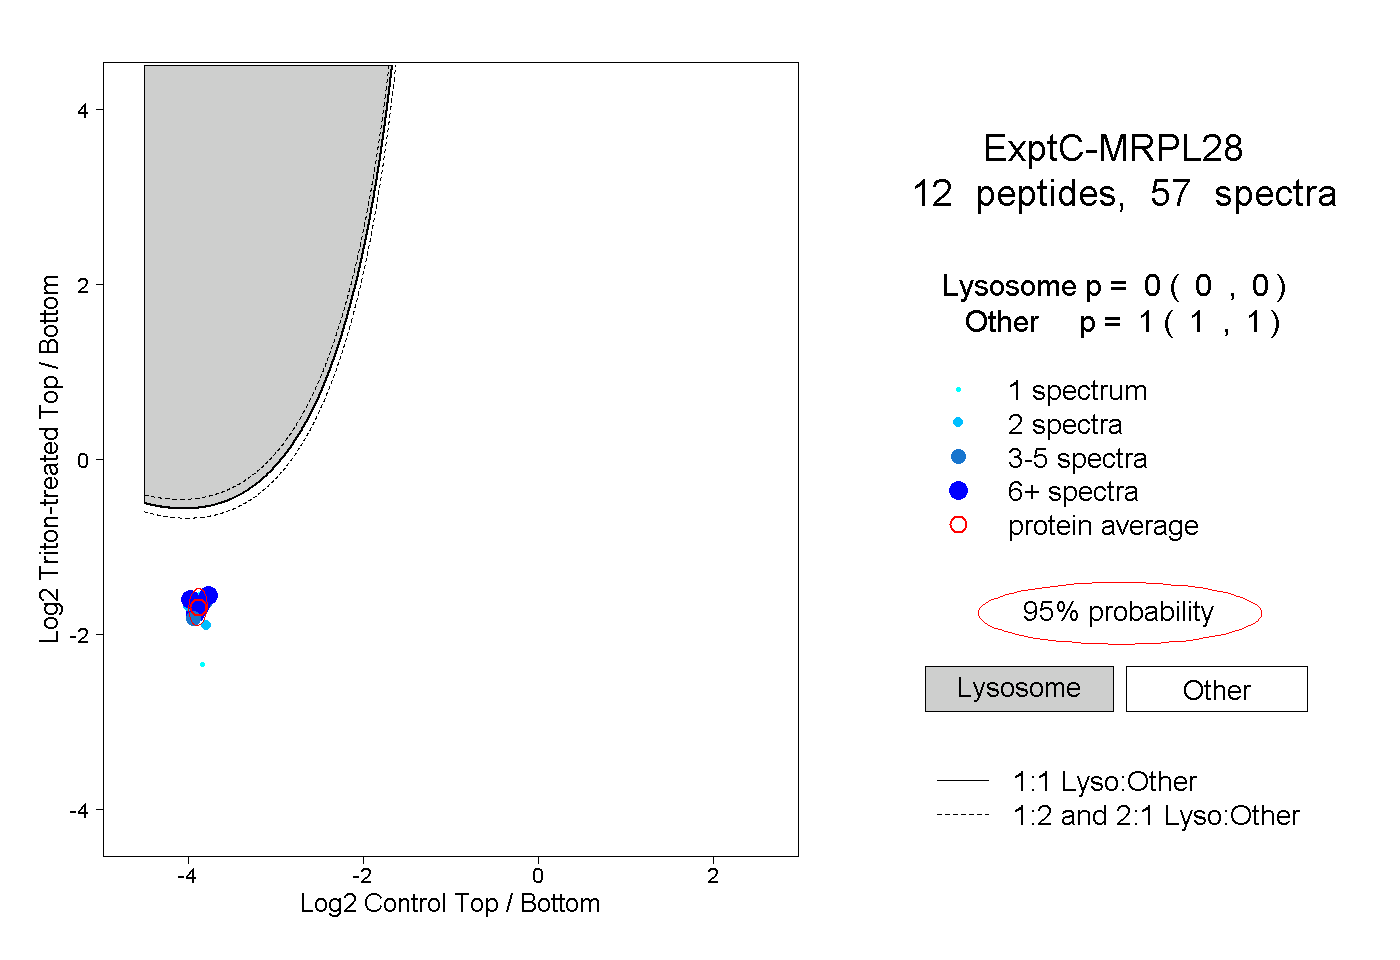 |
0.000 0.000 | 0.000 |
1.000 1.000 | 1.000 |
||||||||
| Plot | Lyso | Other | |||||||||||
| Expt D |
3 peptides |
7 spectra |
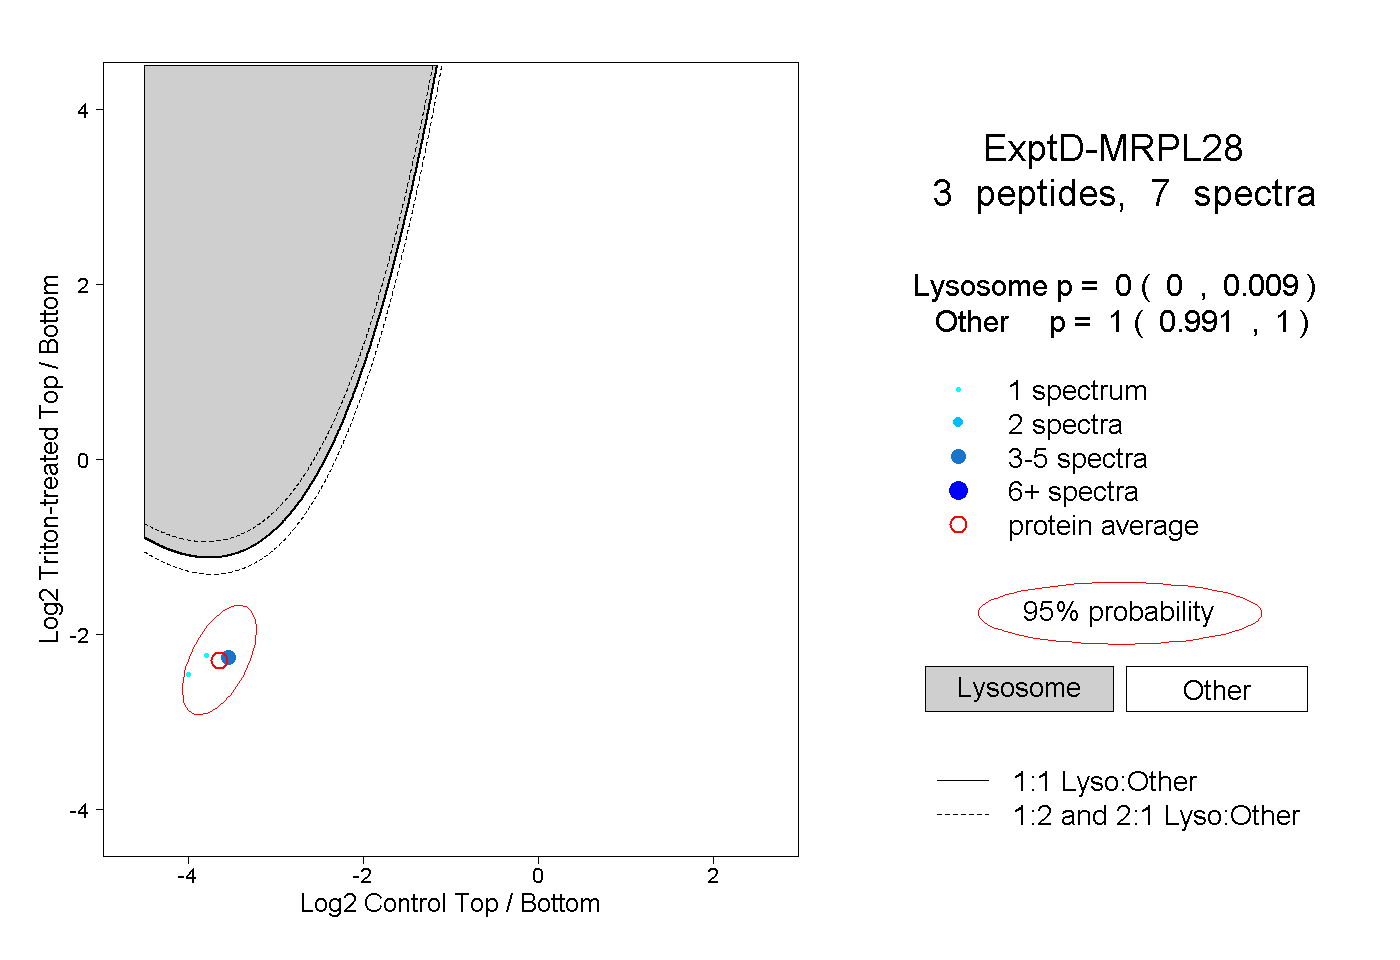 |
0.000 0.000 | 0.009 |
1.000 0.991 | 1.000 |