 4
4peptides
spectra
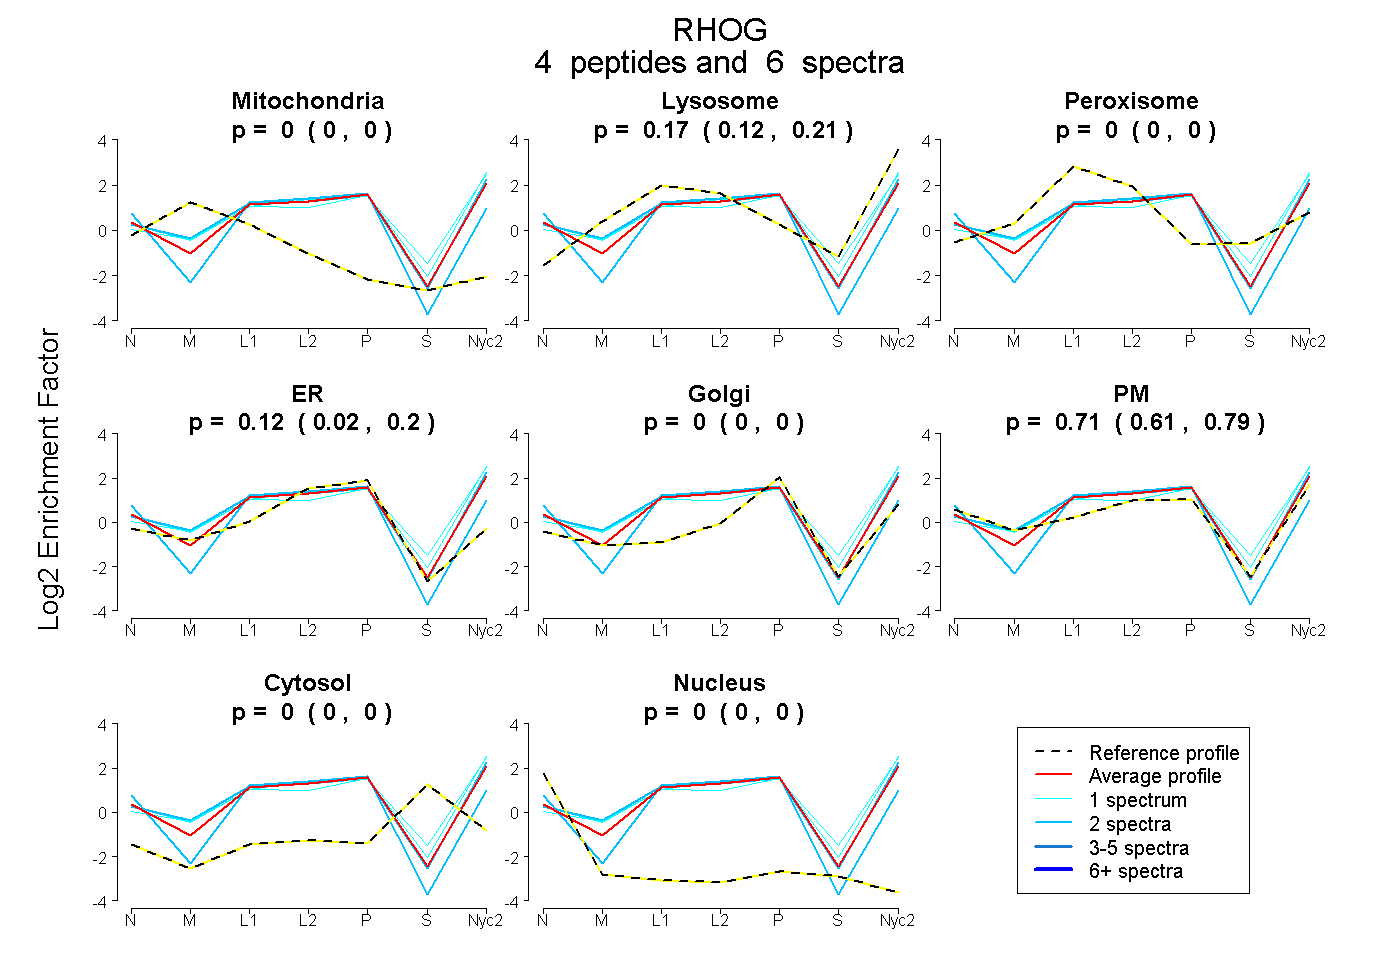
0.000 | 0.000
0.116 | 0.211
0.000 | 0.000
0.021 | 0.203
0.000 | 0.000
0.606 | 0.792
0.000 | 0.000
0.000 | 0.000
3peptides
spectra
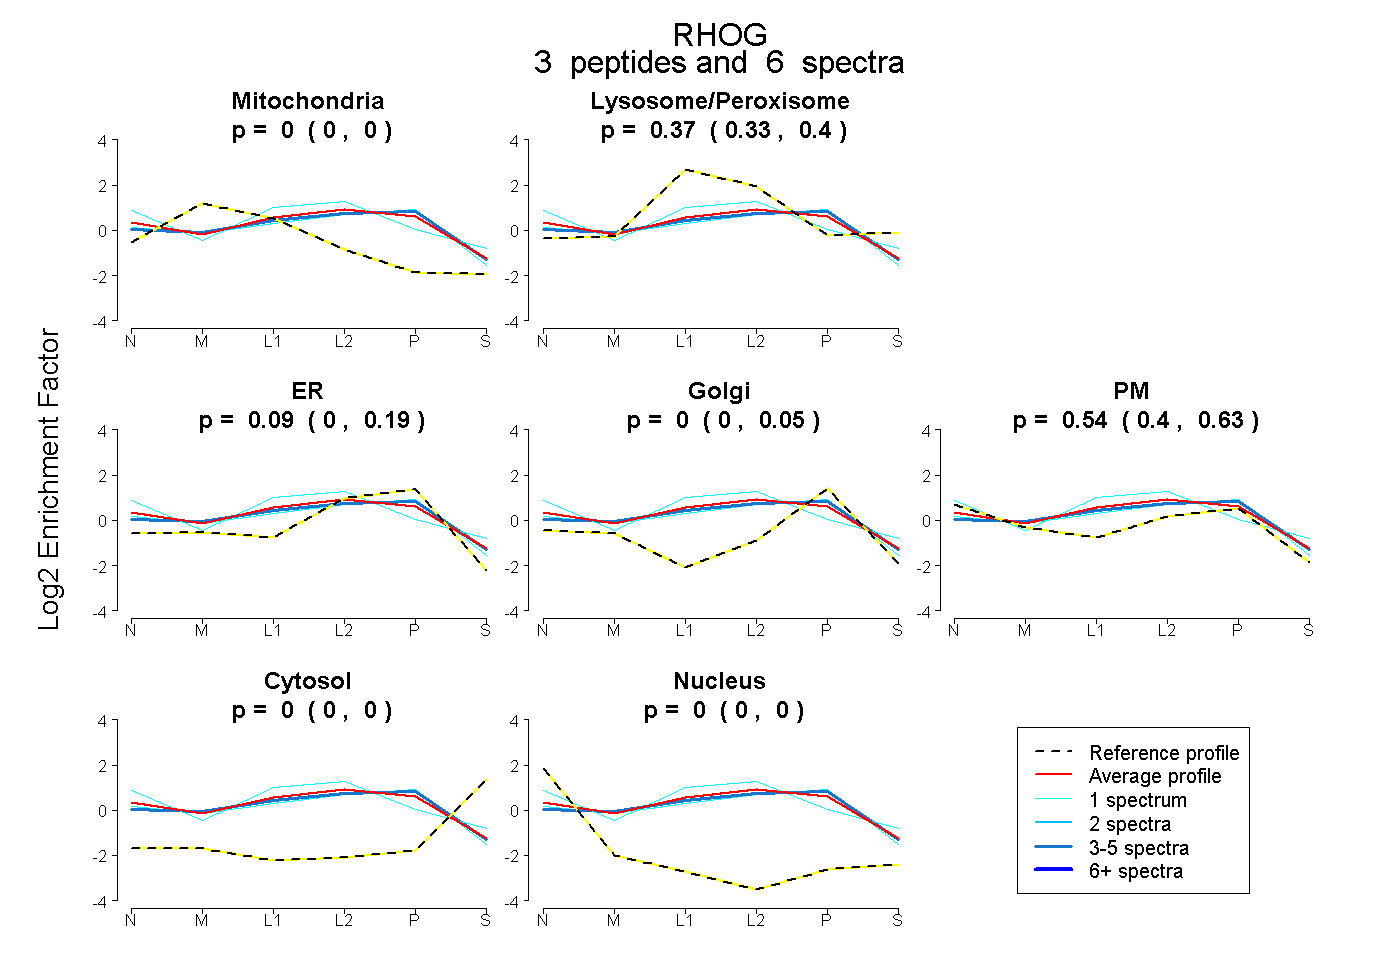
0.000 | 0.000
0.332 | 0.400
0.000 | 0.186
0.000 | 0.045
0.402 | 0.625
0.000 | 0.000
0.000 | 0.000
6peptides
spectra
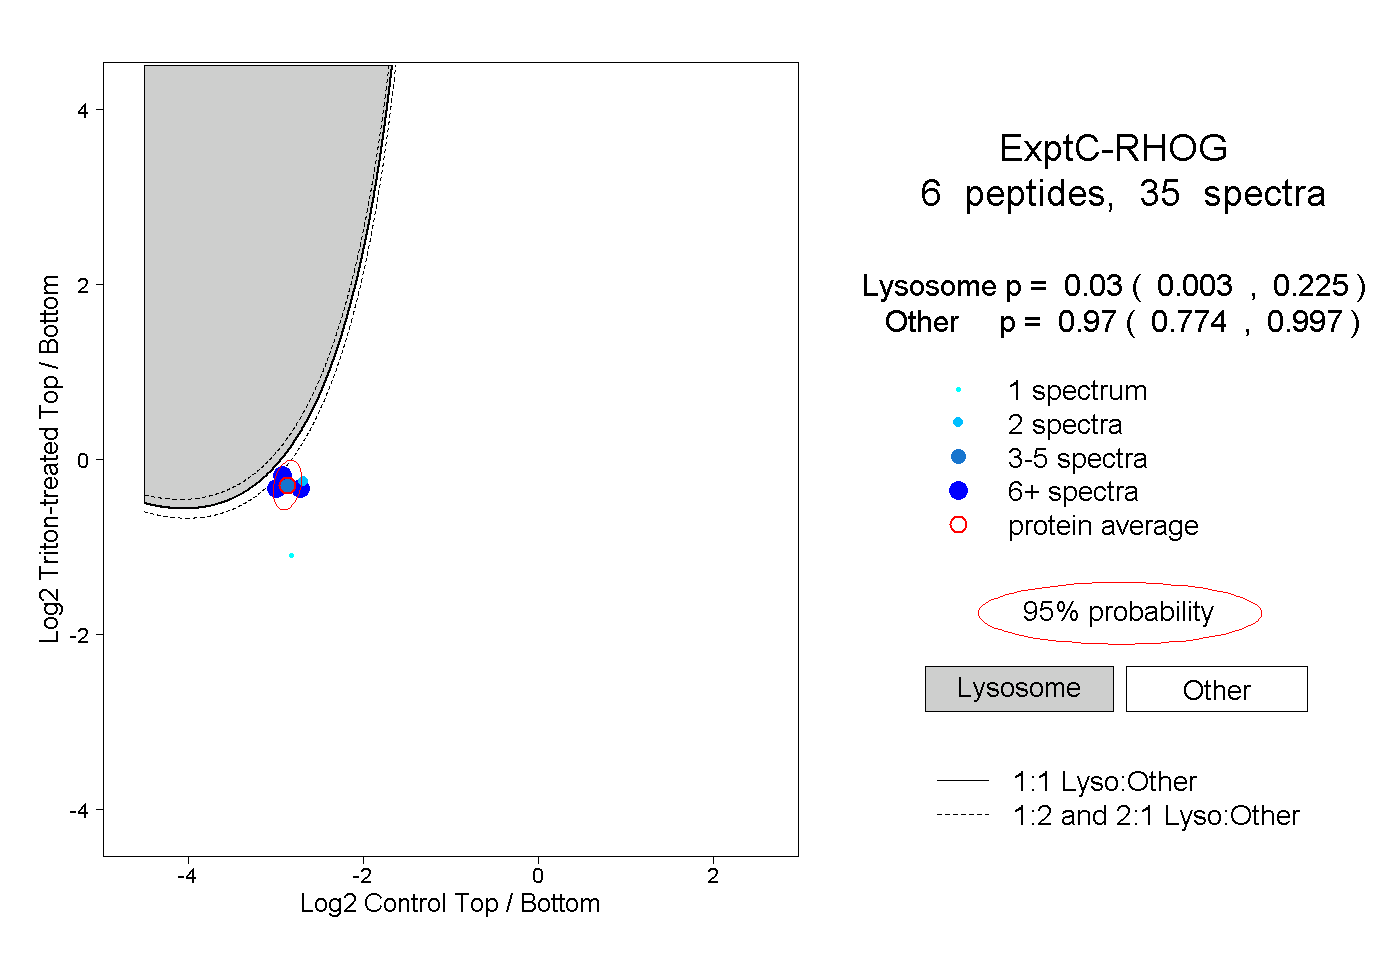
0.003 | 0.225
0.774 | 0.997
1peptide
spectra
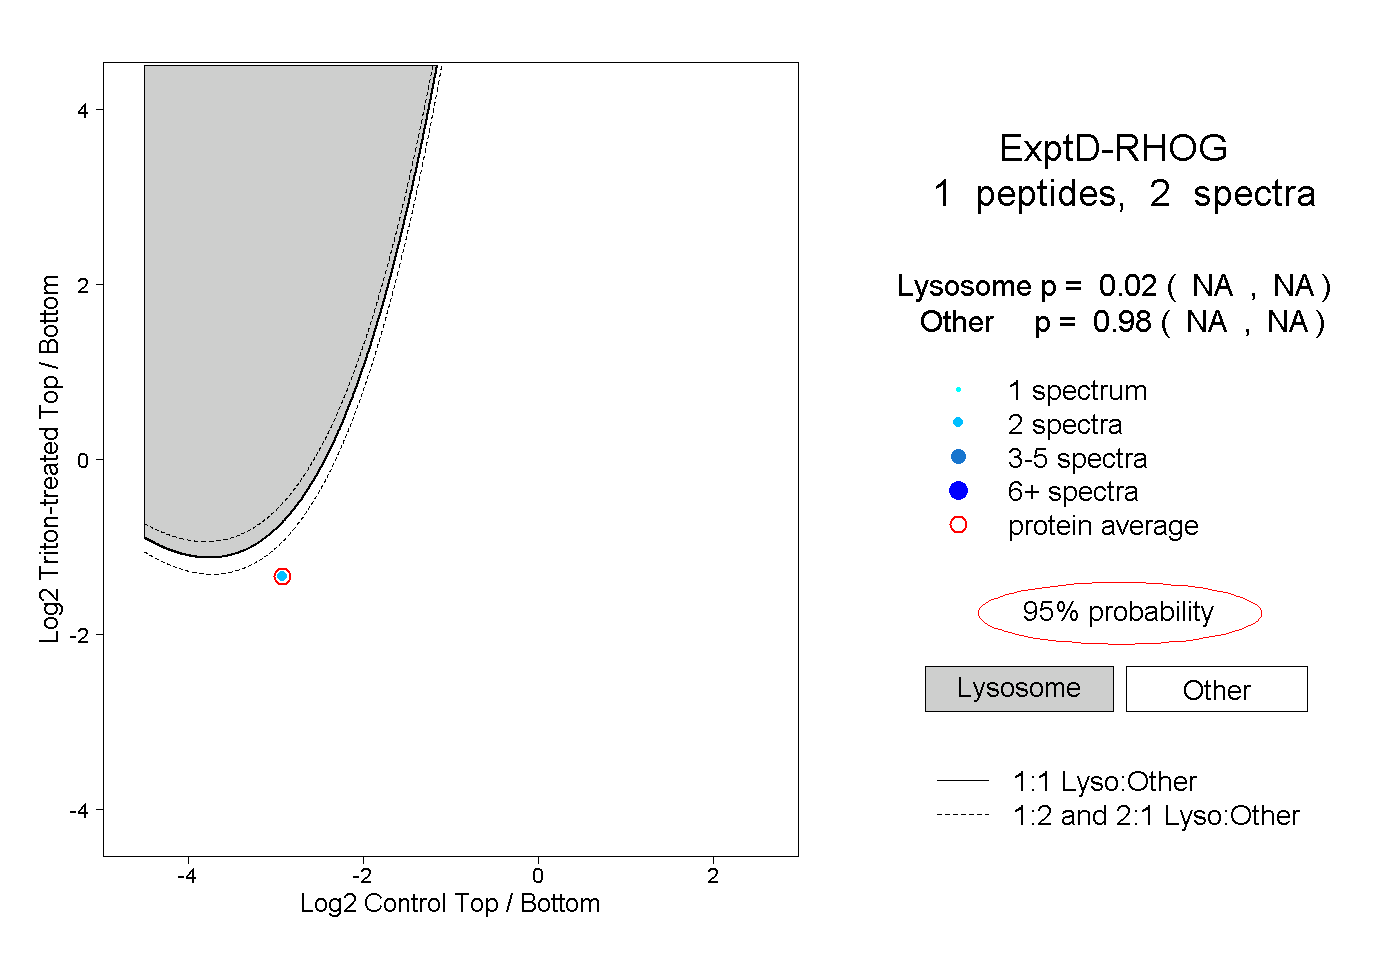
NA | NA
NA | NA