 1
1peptide
spectrum
NA | NA
NA | NA
NA | NA
NA | NA
NA | NA
NA | NA
NA | NA
NA | NA
1peptide
spectra
0.000 | 0.000
1.000 | 1.000
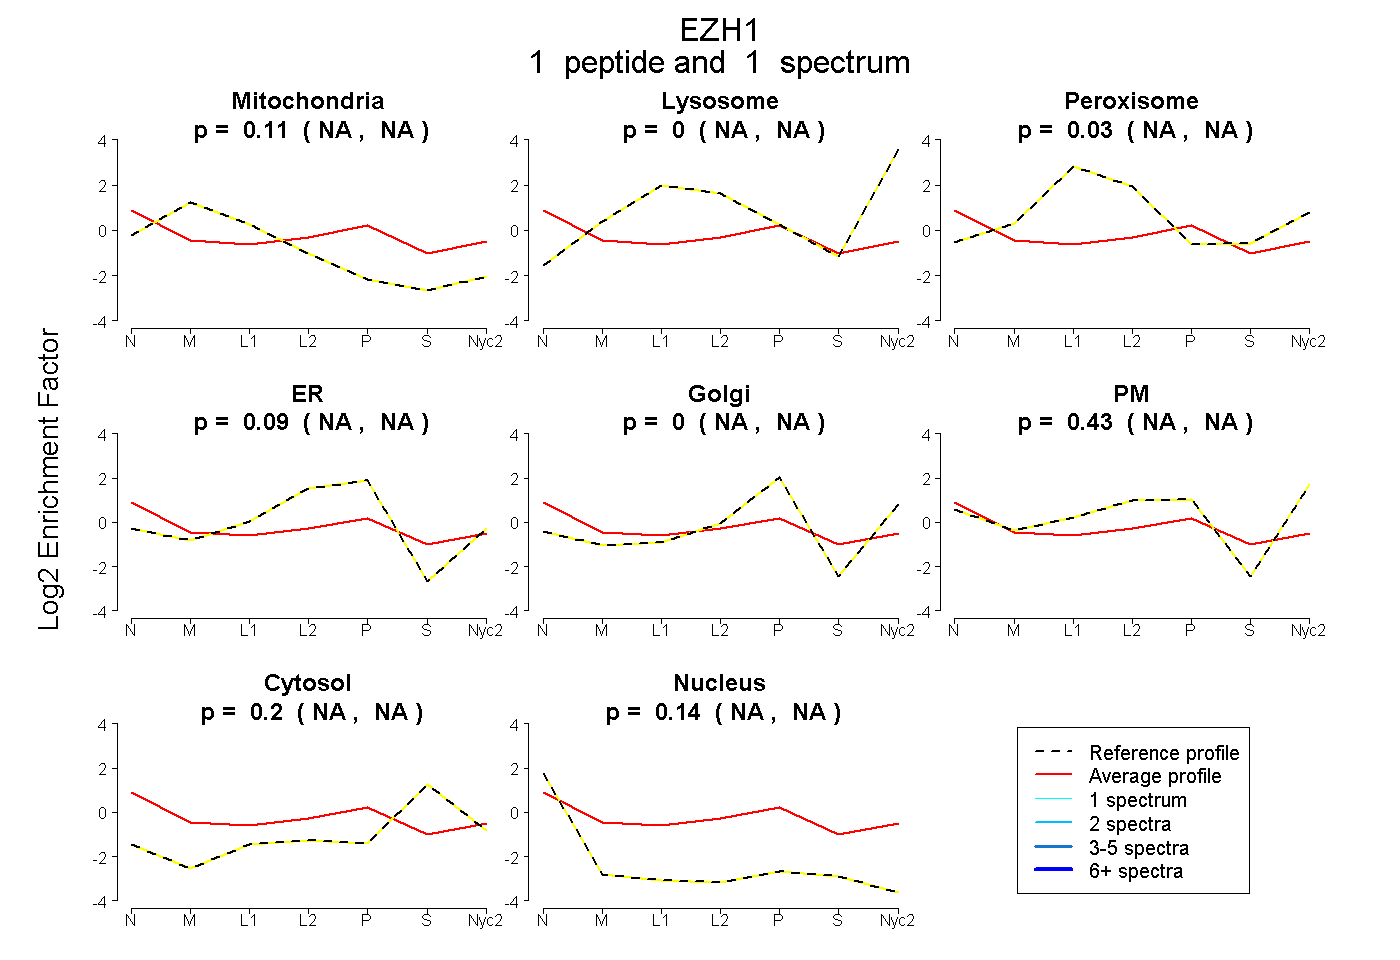
| Plot | Mito | Lyso | Perox | ER | Golgi | PM | Cytosol | Nucleus | |||||
| Expt A |
1 peptide |
1 spectrum |
|
0.107 NA | NA |
0.000 NA | NA |
0.035 NA | NA |
0.088 NA | NA |
0.000 NA | NA |
0.425 NA | NA |
0.205 NA | NA |
0.140 NA | NA |
||
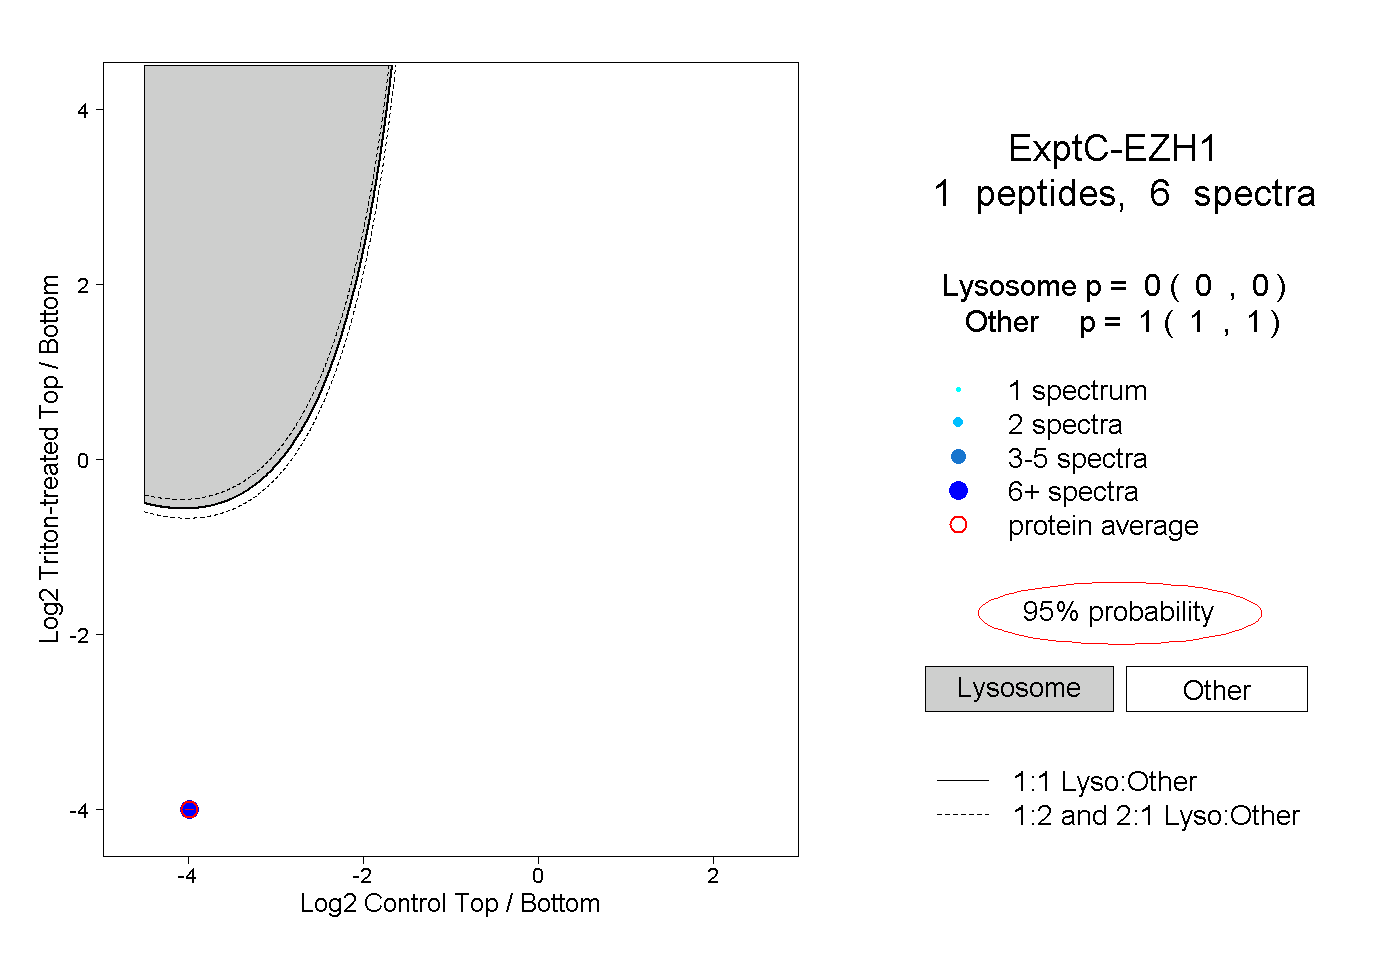
| Plot | Lyso | Other | |||||||||||
| Expt C |
1 peptide |
6 spectra |
|
0.000 0.000 | 0.000 |
1.000 1.000 | 1.000 |