 5
5peptides
spectra
0.000 | 0.111
0.000 | 0.000
0.000 | 0.056
0.000 | 0.000
0.000 | 0.063
0.501 | 0.642
0.231 | 0.366
0.000 | 0.082
| Plot | Mito | Lyso | Perox | ER | Golgi | PM | Cytosol | Nucleus | |||||
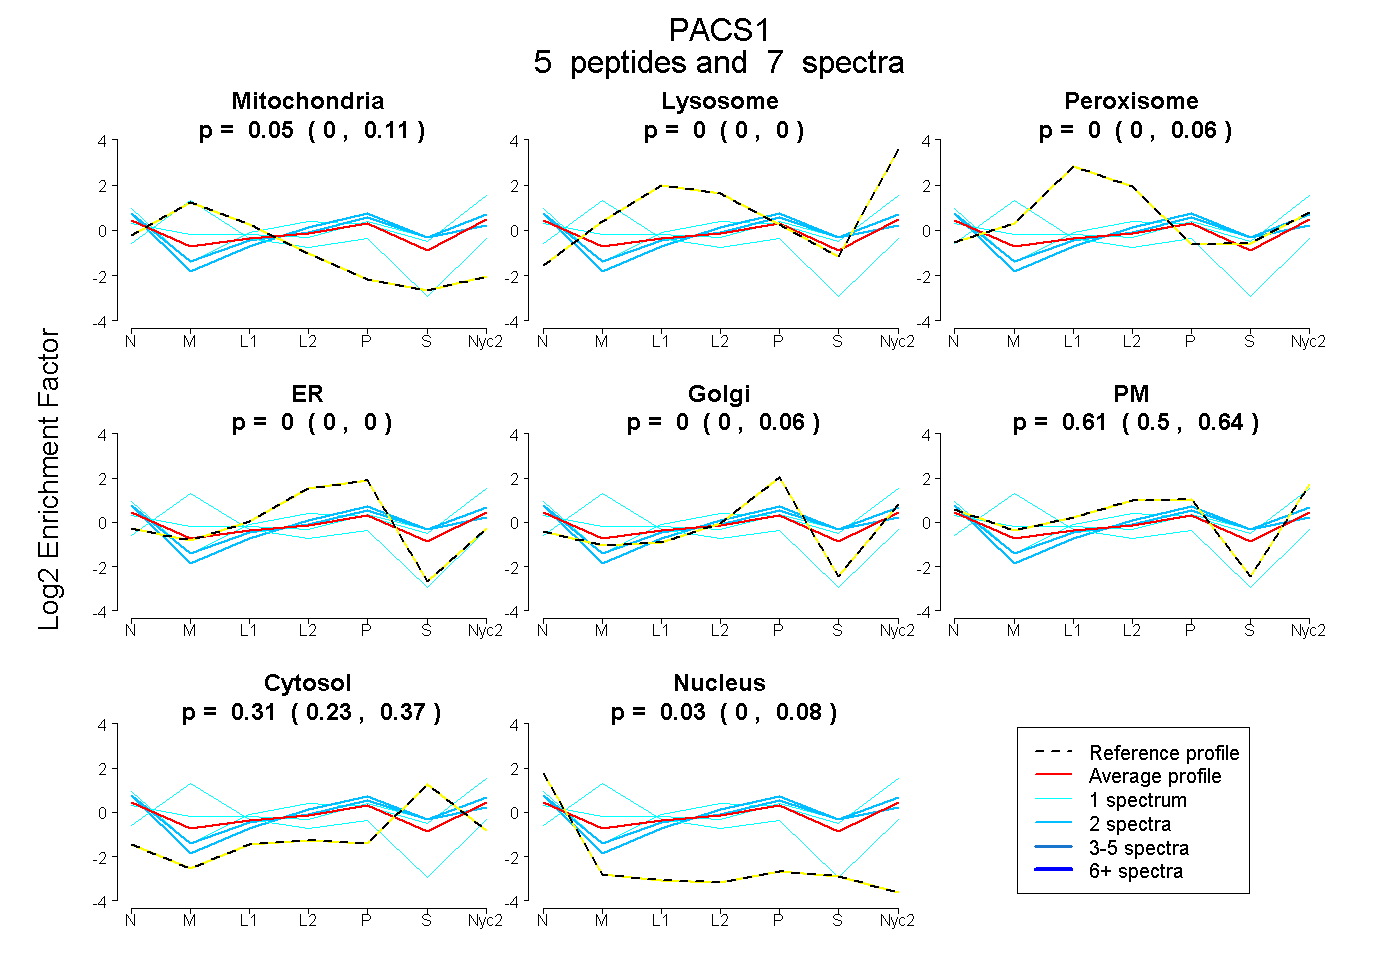
| Expt A |
5 peptides |
7 spectra |
|
0.046 0.000 | 0.111 |
0.000 0.000 | 0.000 |
0.002 0.000 | 0.056 |
0.000 0.000 | 0.000 |
0.000 0.000 | 0.063 |
0.612 0.501 | 0.642 |
0.312 0.231 | 0.366 |
0.028 0.000 | 0.082 |
| 1 spectrum, VEGTHTPR | 0.594 | 0.074 | 0.000 | 0.000 | 0.332 | 0.000 | 0.000 | 0.000 | ||
| 1 spectrum, FIPFIGVVK | 0.000 | 0.006 | 0.018 | 0.000 | 0.000 | 0.676 | 0.300 | 0.000 | ||
| 1 spectrum, DVSVPVAEIK | 0.098 | 0.000 | 0.091 | 0.000 | 0.064 | 0.416 | 0.331 | 0.000 | ||
| 2 spectra, SEPPVSEPLDVVGR | 0.000 | 0.000 | 0.000 | 0.028 | 0.000 | 0.541 | 0.393 | 0.038 | ||
| 2 spectra, FLIVPLGSHPVAK | 0.000 | 0.000 | 0.000 | 0.000 | 0.066 | 0.534 | 0.400 | 0.000 |
| Plot | Mito | Lyso or Perox | ER | Golgi | PM | Cytosol | Nucleus | ||||||
| Expt B |
1 peptide |
1 spectrum |
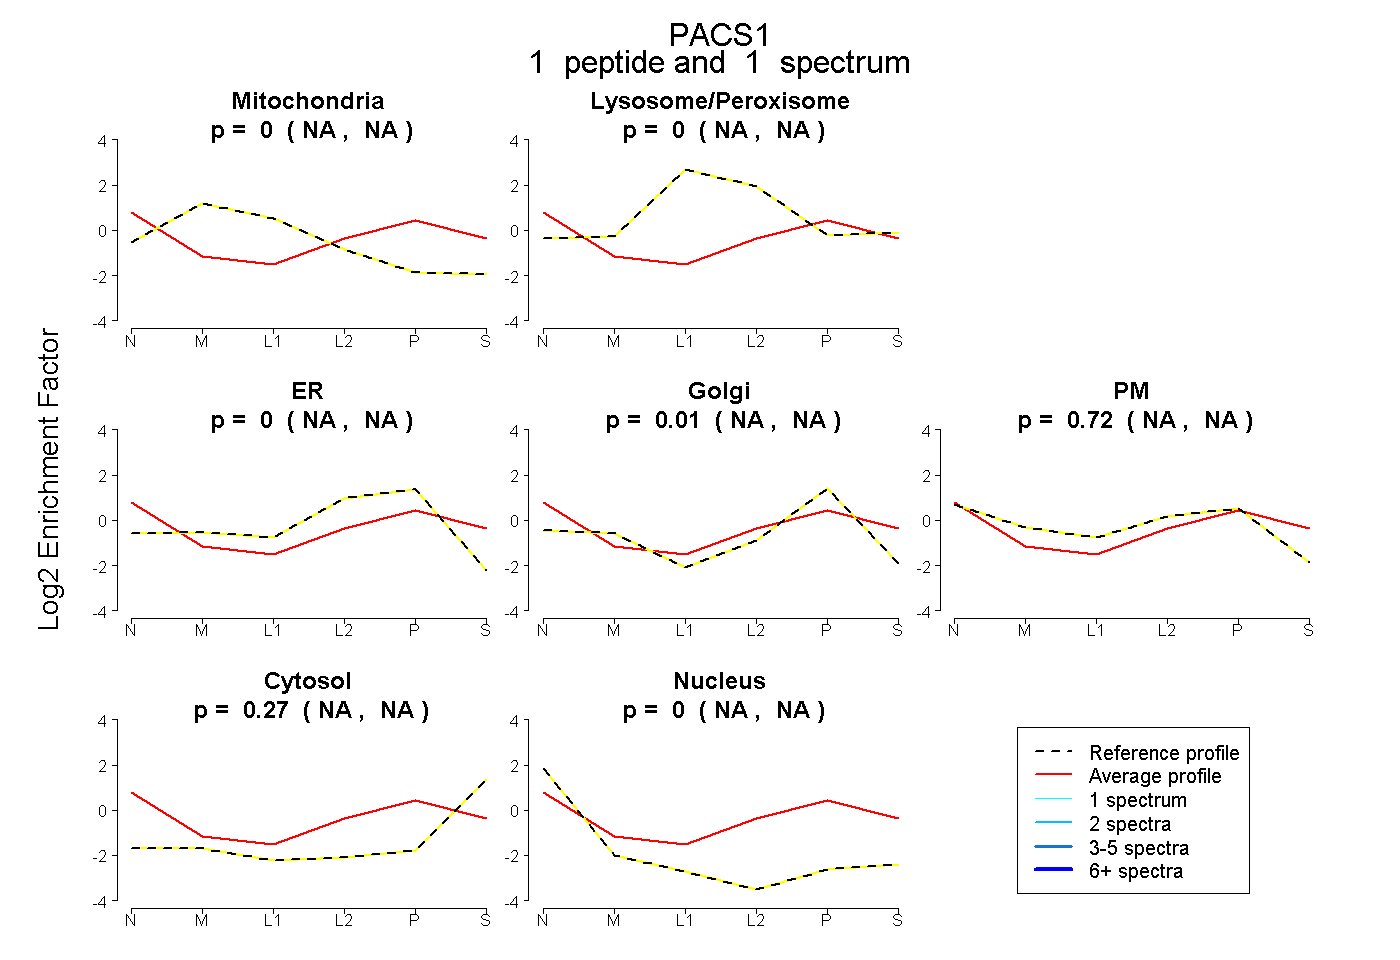 |
0.000 NA | NA |
0.000 NA | NA |
0.000 NA | NA |
0.012 NA | NA |
0.720 NA | NA |
0.268 NA | NA |
0.000 NA | NA |
|||
| Plot | Lyso | Other | |||||||||||
| Expt D |
2 peptides |
2 spectra |
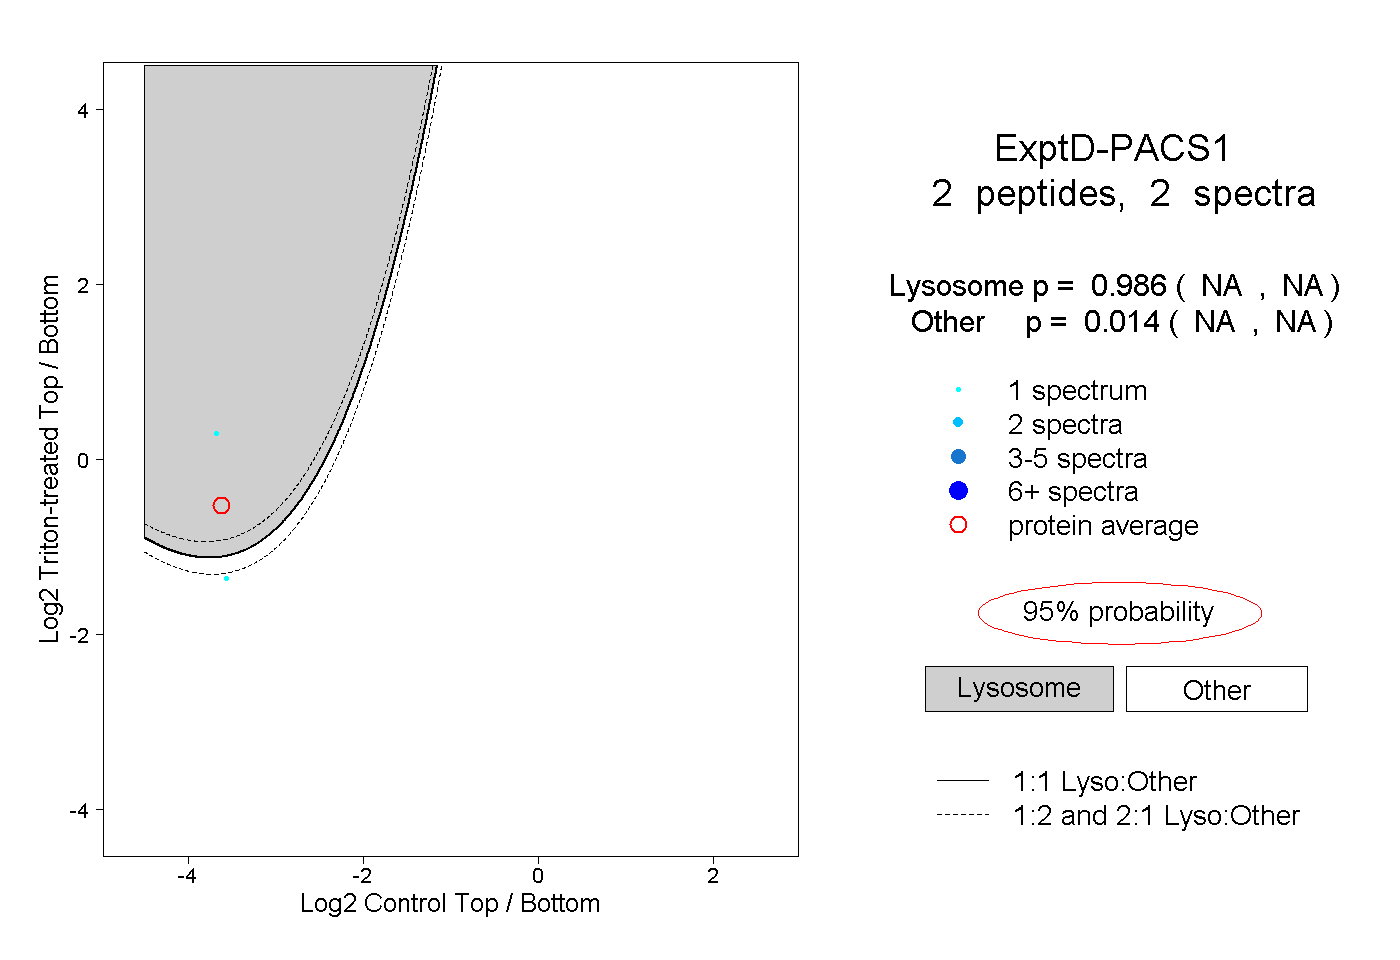 |
0.986 NA | NA |
0.014 NA | NA |