 3
3peptides
spectra
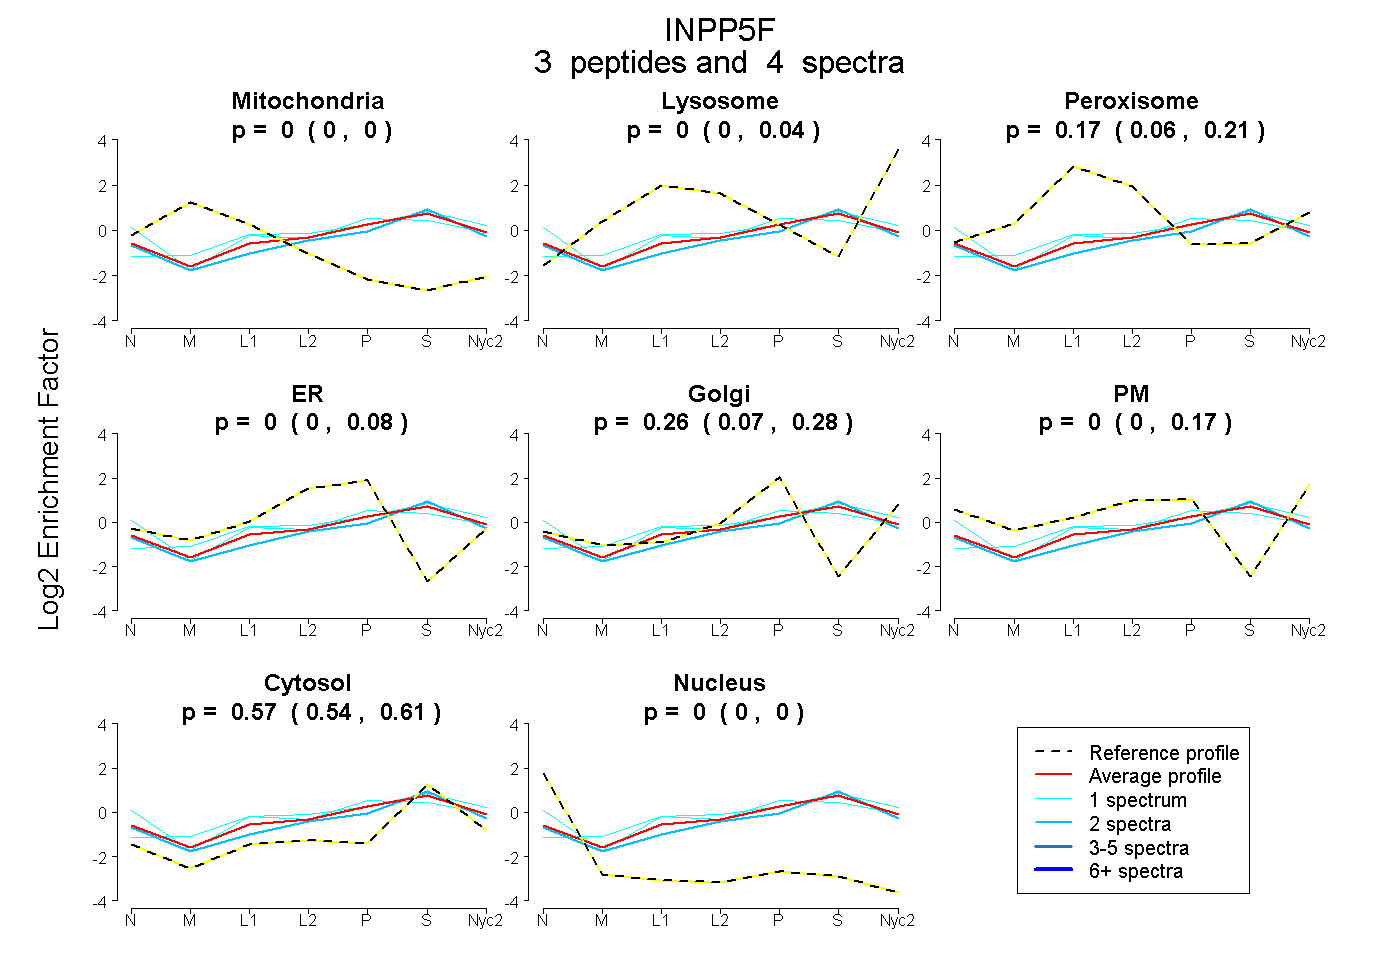
0.000 | 0.000
0.000 | 0.045
0.057 | 0.209
0.000 | 0.080
0.068 | 0.278
0.000 | 0.167
0.537 | 0.613
0.000 | 0.000
2peptides
spectra
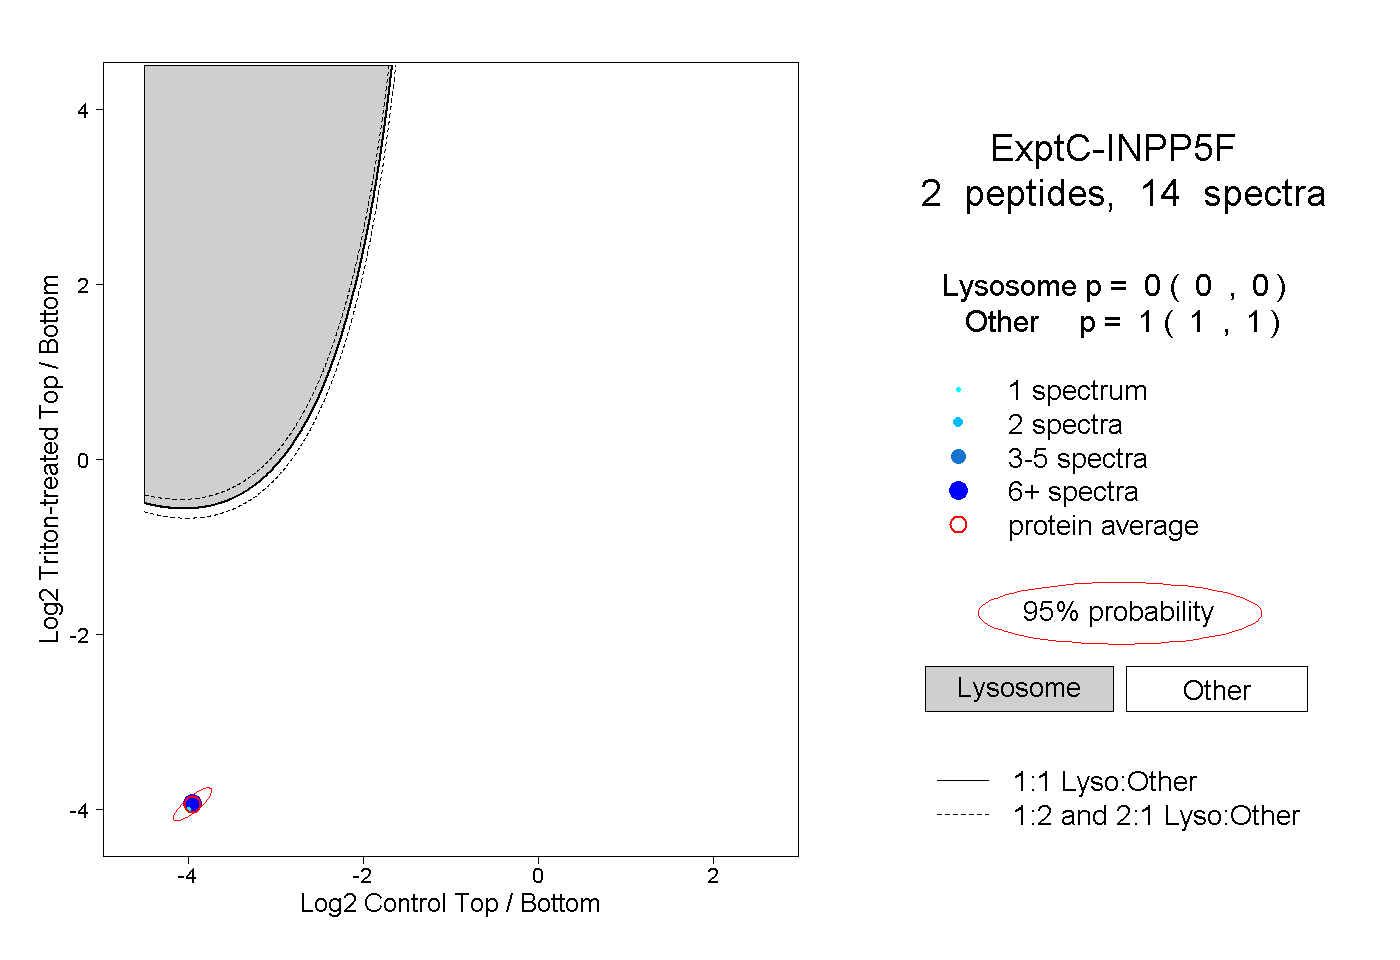
0.000 | 0.000
1.000 | 1.000
| Plot | Mito | Lyso | Perox | ER | Golgi | PM | Cytosol | Nucleus | |||||
| Expt A |
3 peptides |
4 spectra |
|
0.000 0.000 | 0.000 |
0.000 0.000 | 0.045 |
0.172 0.057 | 0.209 |
0.000 0.000 | 0.080 |
0.261 0.068 | 0.278 |
0.000 0.000 | 0.167 |
0.567 0.537 | 0.613 |
0.000 0.000 | 0.000 |
||
| Plot | Lyso | Other | |||||||||||
| Expt C |
2 peptides |
14 spectra |
|
0.000 0.000 | 0.000 |
1.000 1.000 | 1.000 |