 5
5peptides
spectra
0.000 | 0.000
0.000 | 0.000
0.000 | 0.006
0.094 | 0.182
0.000 | 0.047
0.000 | 0.044
0.789 | 0.827
0.000 | 0.040
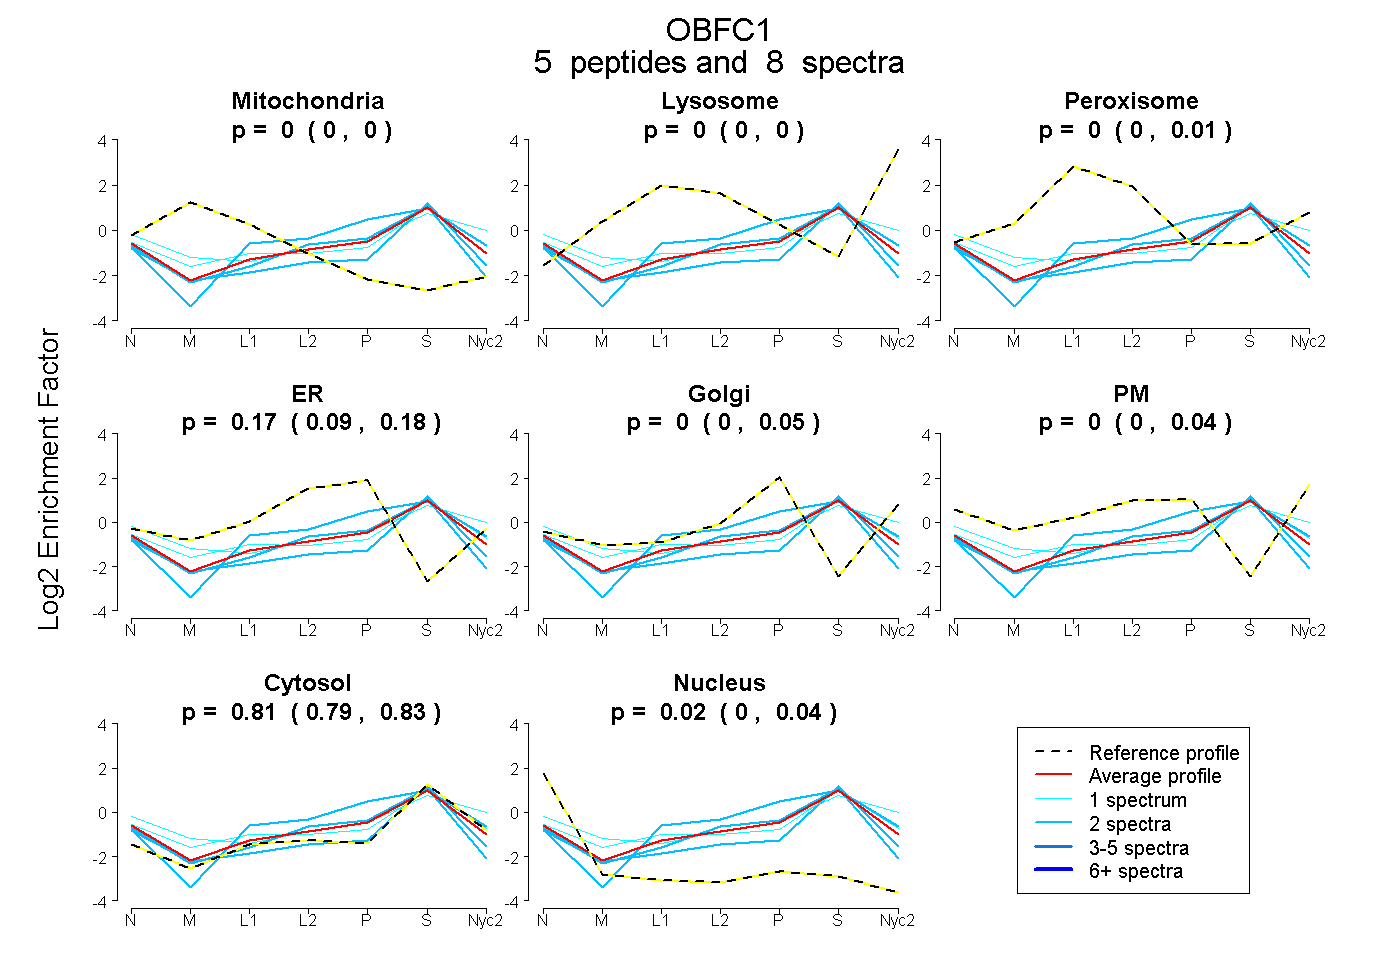
| Plot | Mito | Lyso | Perox | ER | Golgi | PM | Cytosol | Nucleus | |||||
| Expt A |
5 peptides |
8 spectra |
|
0.000 0.000 | 0.000 |
0.000 0.000 | 0.000 |
0.000 0.000 | 0.006 |
0.165 0.094 | 0.182 |
0.000 0.000 | 0.047 |
0.000 0.000 | 0.044 |
0.813 0.789 | 0.827 |
0.022 0.000 | 0.040 |
| 2 spectra, RPSNAESSSDPAILSTSR | 0.000 | 0.000 | 0.000 | 0.260 | 0.000 | 0.000 | 0.740 | 0.000 | ||
| 2 spectra, IGIGDIIR | 0.000 | 0.000 | 0.000 | 0.000 | 0.000 | 0.000 | 0.883 | 0.117 | ||
| 1 spectrum, LYGAILK | 0.058 | 0.000 | 0.037 | 0.000 | 0.000 | 0.122 | 0.783 | 0.000 | ||
| 2 spectra, GFVFQR | 0.000 | 0.000 | 0.000 | 0.145 | 0.000 | 0.000 | 0.774 | 0.081 | ||
| 1 spectrum, EEEALNSK | 0.001 | 0.000 | 0.000 | 0.000 | 0.000 | 0.297 | 0.701 | 0.001 |