 7
7peptides
spectra
0.000 | 0.000
0.000 | 0.000
0.000 | 0.000
0.175 | 0.243
0.552 | 0.629
0.000 | 0.000
0.080 | 0.138
0.065 | 0.095
| Plot | Mito | Lyso | Perox | ER | Golgi | PM | Cytosol | Nucleus | |||||
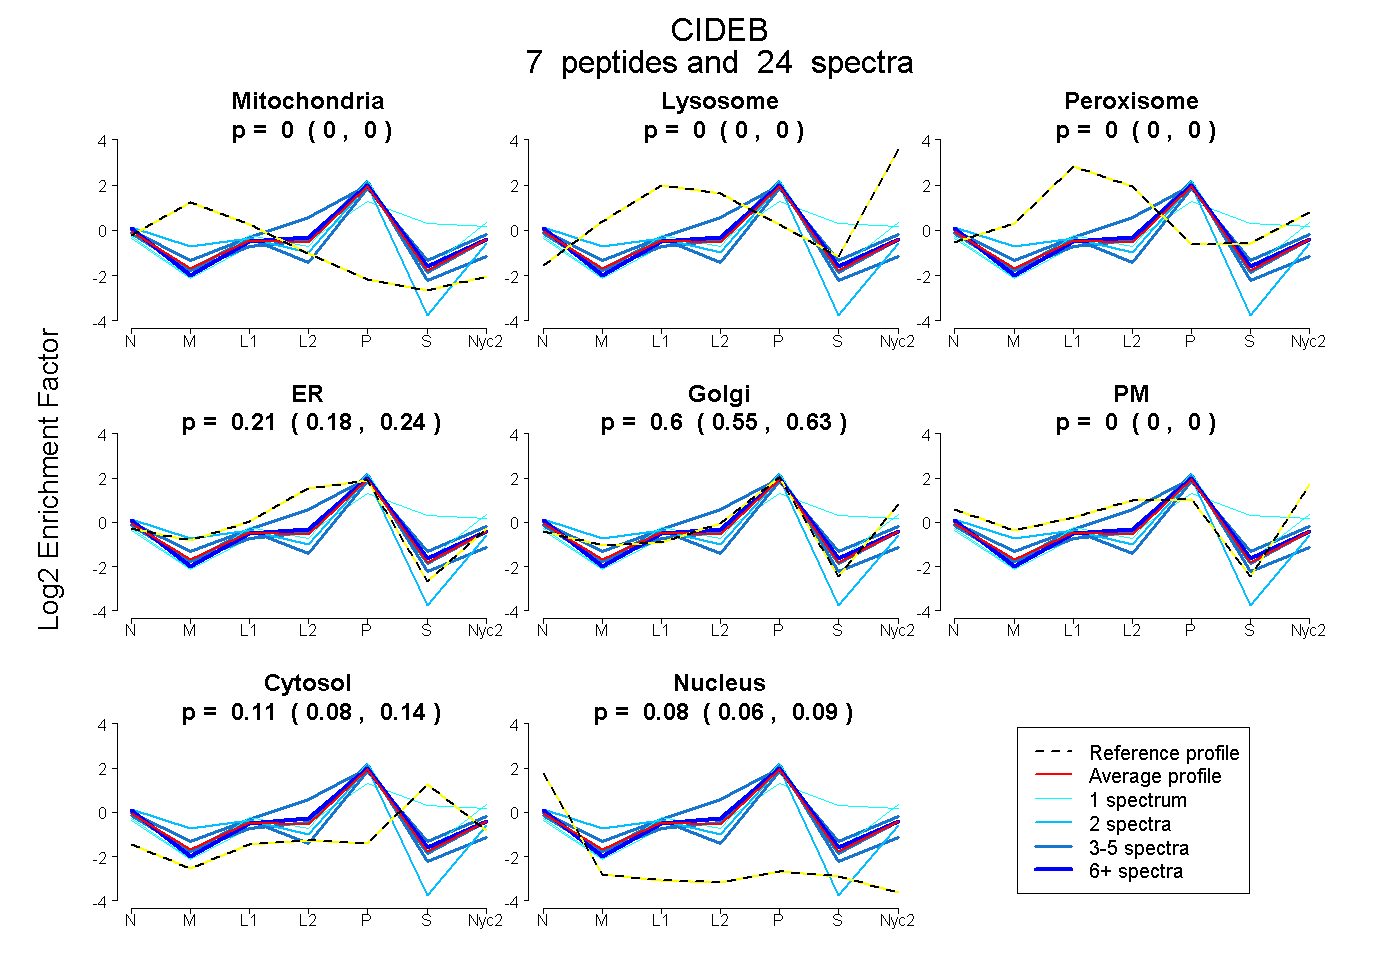
| Expt A |
7 peptides |
24 spectra |
|
0.000 0.000 | 0.000 |
0.000 0.000 | 0.000 |
0.000 0.000 | 0.000 |
0.211 0.175 | 0.243 |
0.596 0.552 | 0.629 |
0.000 0.000 | 0.000 |
0.112 0.080 | 0.138 |
0.081 0.065 | 0.095 |
| 1 spectrum, VCDHK | 0.000 | 0.000 | 0.000 | 0.000 | 0.861 | 0.000 | 0.139 | 0.000 | ||
| 3 spectra, HVVEGAER | 0.000 | 0.000 | 0.000 | 0.615 | 0.252 | 0.000 | 0.107 | 0.026 | ||
| 8 spectra, VWNSAPPPQRPFR | 0.000 | 0.000 | 0.000 | 0.268 | 0.519 | 0.000 | 0.141 | 0.072 | ||
| 4 spectra, GLTAATR | 0.000 | 0.000 | 0.000 | 0.362 | 0.449 | 0.000 | 0.022 | 0.168 | ||
| 2 spectra, SVSTMSSELSR | 0.088 | 0.000 | 0.000 | 0.171 | 0.628 | 0.000 | 0.000 | 0.113 | ||
| 1 spectrum, DLFGSLNVK | 0.000 | 0.000 | 0.028 | 0.000 | 0.504 | 0.000 | 0.468 | 0.000 | ||
| 5 spectra, SGMLSYGLGR | 0.000 | 0.000 | 0.000 | 0.000 | 0.732 | 0.000 | 0.198 | 0.070 |
| Plot | Mito | Lyso or Perox | ER | Golgi | PM | Cytosol | Nucleus | ||||||
| Expt B |
1 peptide |
2 spectra |
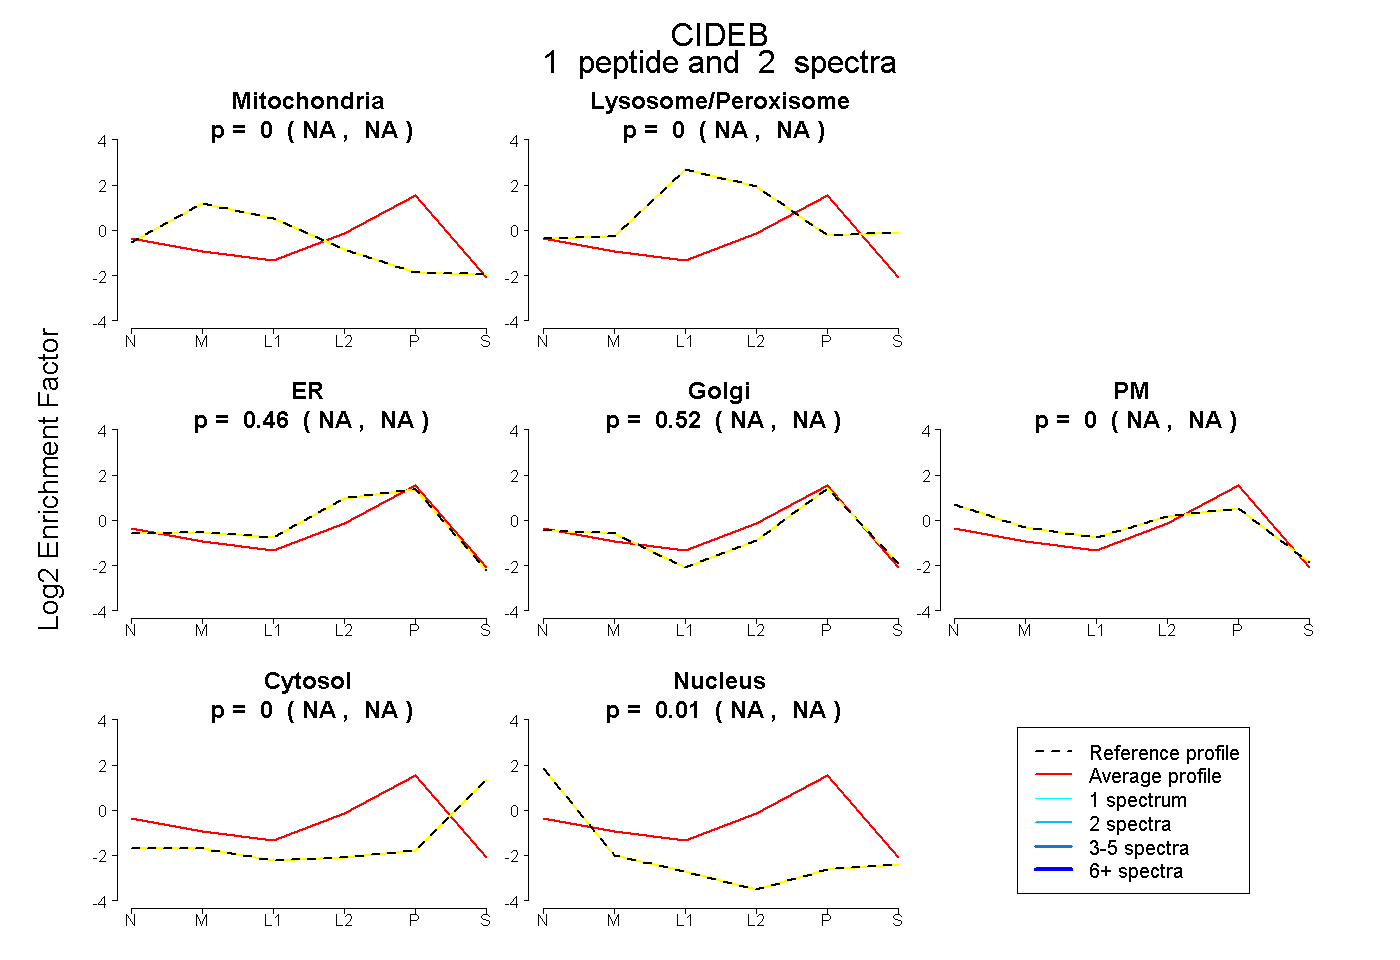 |
0.000 NA | NA |
0.000 NA | NA |
0.463 NA | NA |
0.523 NA | NA |
0.000 NA | NA |
0.000 NA | NA |
0.014 NA | NA |
|||
| Plot | Lyso | Other | |||||||||||
| Expt C |
3 peptides |
6 spectra |
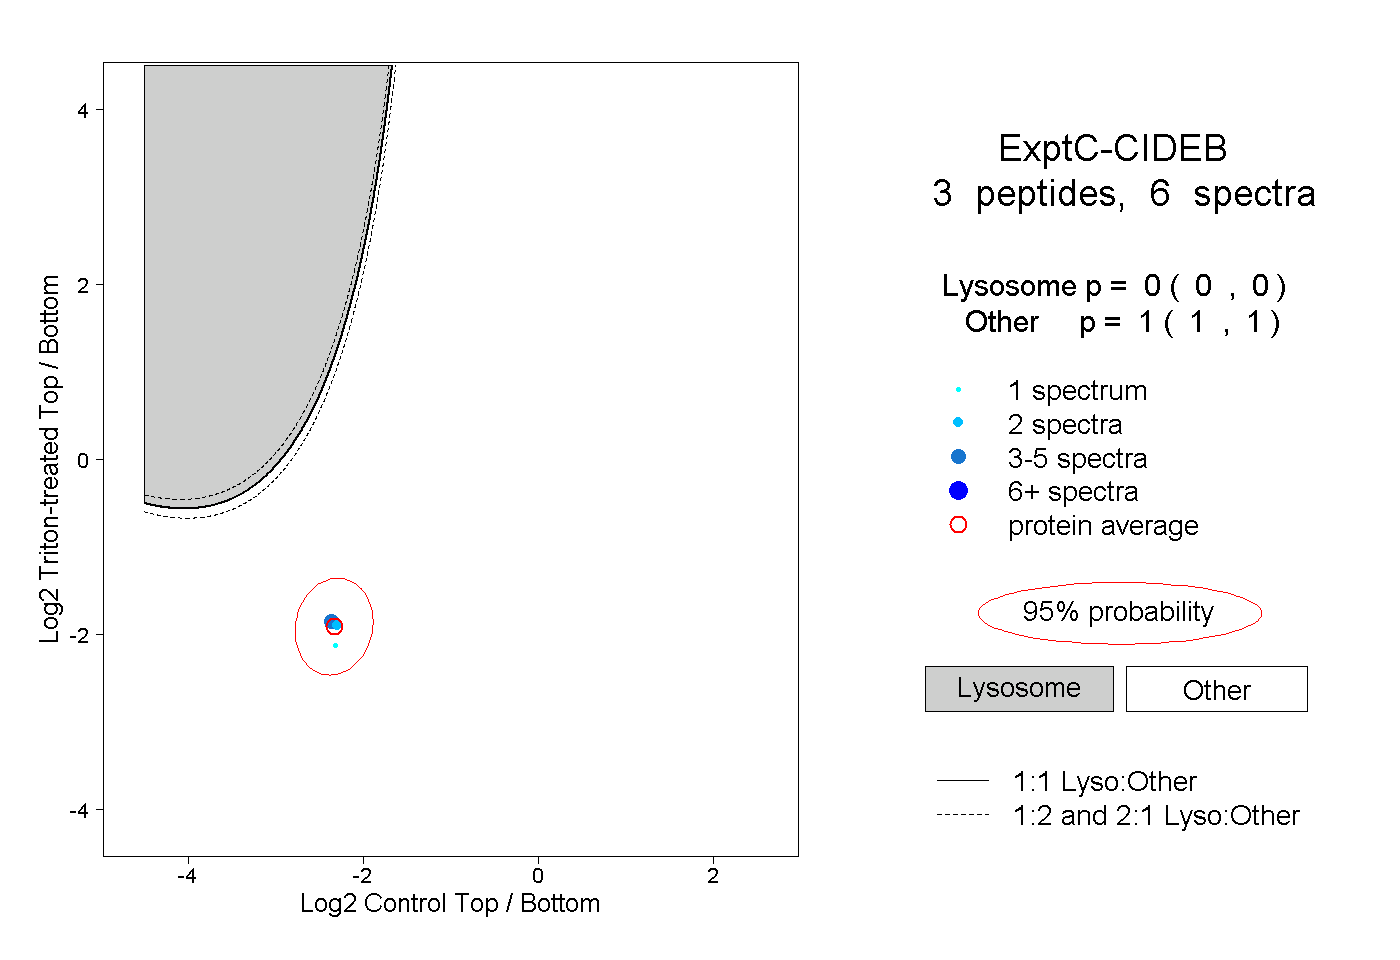 |
0.000 0.000 | 0.000 |
1.000 1.000 | 1.000 |
||||||||
| Plot | Lyso | Other | |||||||||||
| Expt D |
1 peptide |
1 spectrum |
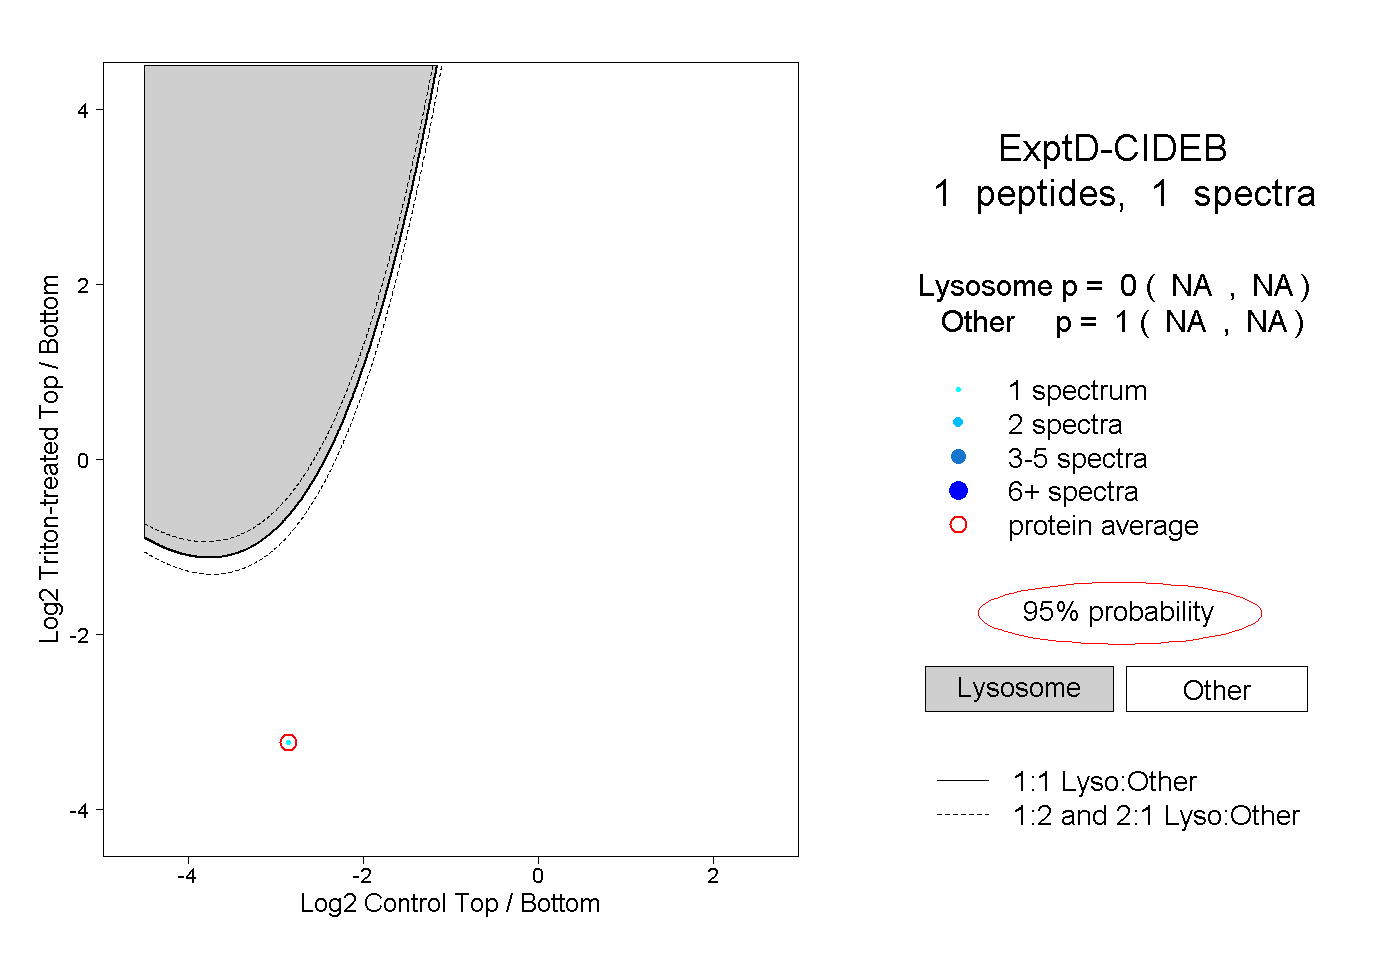 |
0.000 NA | NA |
1.000 NA | NA |