 9
9peptides
spectra
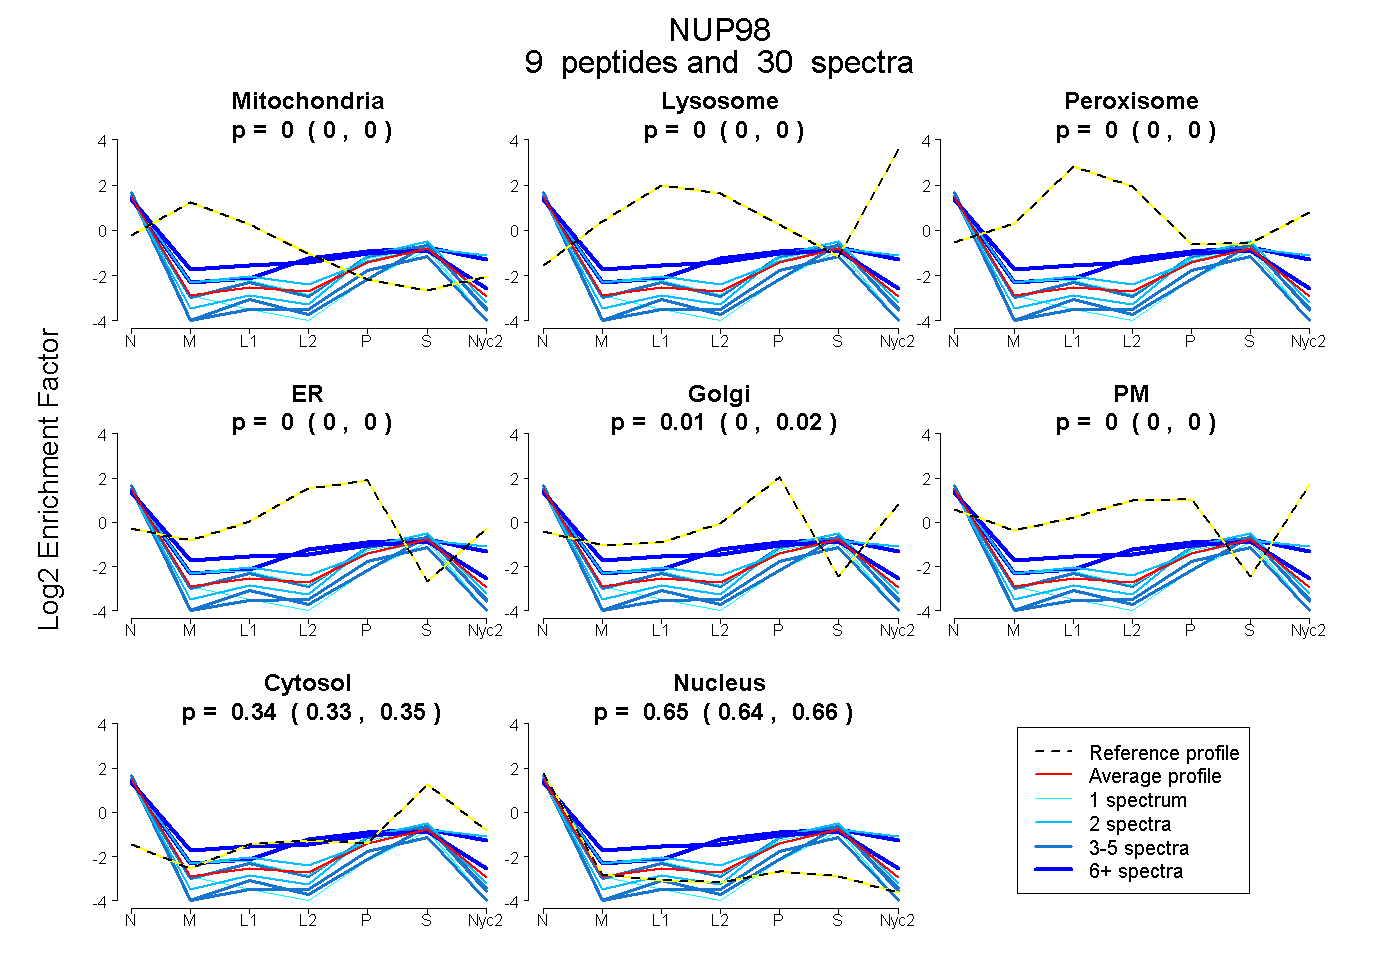
0.000 | 0.000
0.000 | 0.000
0.000 | 0.000
0.000 | 0.000
0.000 | 0.017
0.000 | 0.000
0.332 | 0.345
0.641 | 0.664
| Plot | Mito | Lyso | Perox | ER | Golgi | PM | Cytosol | Nucleus | |||||
| Expt A |
9 peptides |
30 spectra |
|
0.000 0.000 | 0.000 |
0.000 0.000 | 0.000 |
0.000 0.000 | 0.000 |
0.000 0.000 | 0.000 |
0.006 0.000 | 0.017 |
0.000 0.000 | 0.000 |
0.340 0.332 | 0.345 |
0.654 0.641 | 0.664 |
| 2 spectra, GLTQSYLR | 0.000 | 0.000 | 0.000 | 0.000 | 0.000 | 0.180 | 0.338 | 0.482 | ||
| 1 spectrum, DLLELPIVK | 0.000 | 0.000 | 0.000 | 0.000 | 0.000 | 0.000 | 0.144 | 0.856 | ||
| 6 spectra, FGHFPSR | 0.000 | 0.000 | 0.000 | 0.000 | 0.000 | 0.256 | 0.324 | 0.420 | ||
| 3 spectra, GDTAQEICSPR | 0.000 | 0.000 | 0.000 | 0.000 | 0.000 | 0.000 | 0.336 | 0.664 | ||
| 1 spectrum, GECIVSDFTIGR | 0.000 | 0.000 | 0.000 | 0.015 | 0.000 | 0.000 | 0.283 | 0.702 | ||
| 3 spectra, LPMPEDYALEELR | 0.000 | 0.000 | 0.000 | 0.000 | 0.000 | 0.000 | 0.220 | 0.780 | ||
| 2 spectra, SITADPLDYR | 0.000 | 0.000 | 0.000 | 0.000 | 0.000 | 0.000 | 0.328 | 0.672 | ||
| 5 spectra, LLAPHIGR | 0.000 | 0.000 | 0.000 | 0.000 | 0.000 | 0.000 | 0.140 | 0.860 | ||
| 7 spectra, VIEMLHR | 0.000 | 0.000 | 0.140 | 0.120 | 0.000 | 0.000 | 0.208 | 0.532 |
| Plot | Mito | Lyso or Perox | ER | Golgi | PM | Cytosol | Nucleus | ||||||
| Expt B |
2 peptides |
2 spectra |
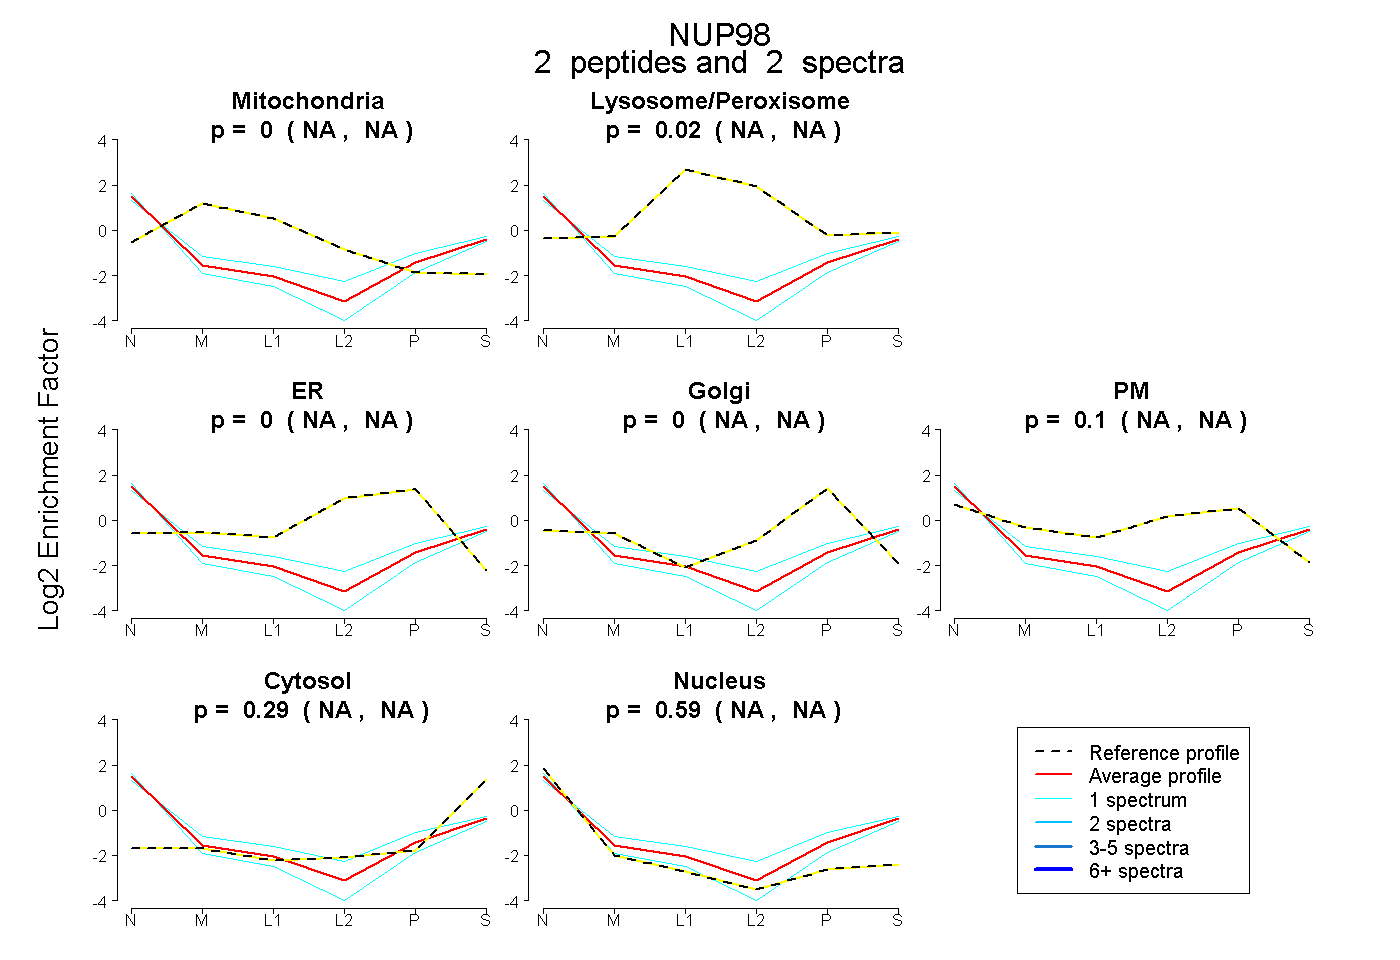 |
0.000 NA | NA |
0.018 NA | NA |
0.000 NA | NA |
0.000 NA | NA |
0.103 NA | NA |
0.291 NA | NA |
0.588 NA | NA |
|||
| Plot | Lyso | Other | |||||||||||
| Expt C |
3 peptides |
6 spectra |
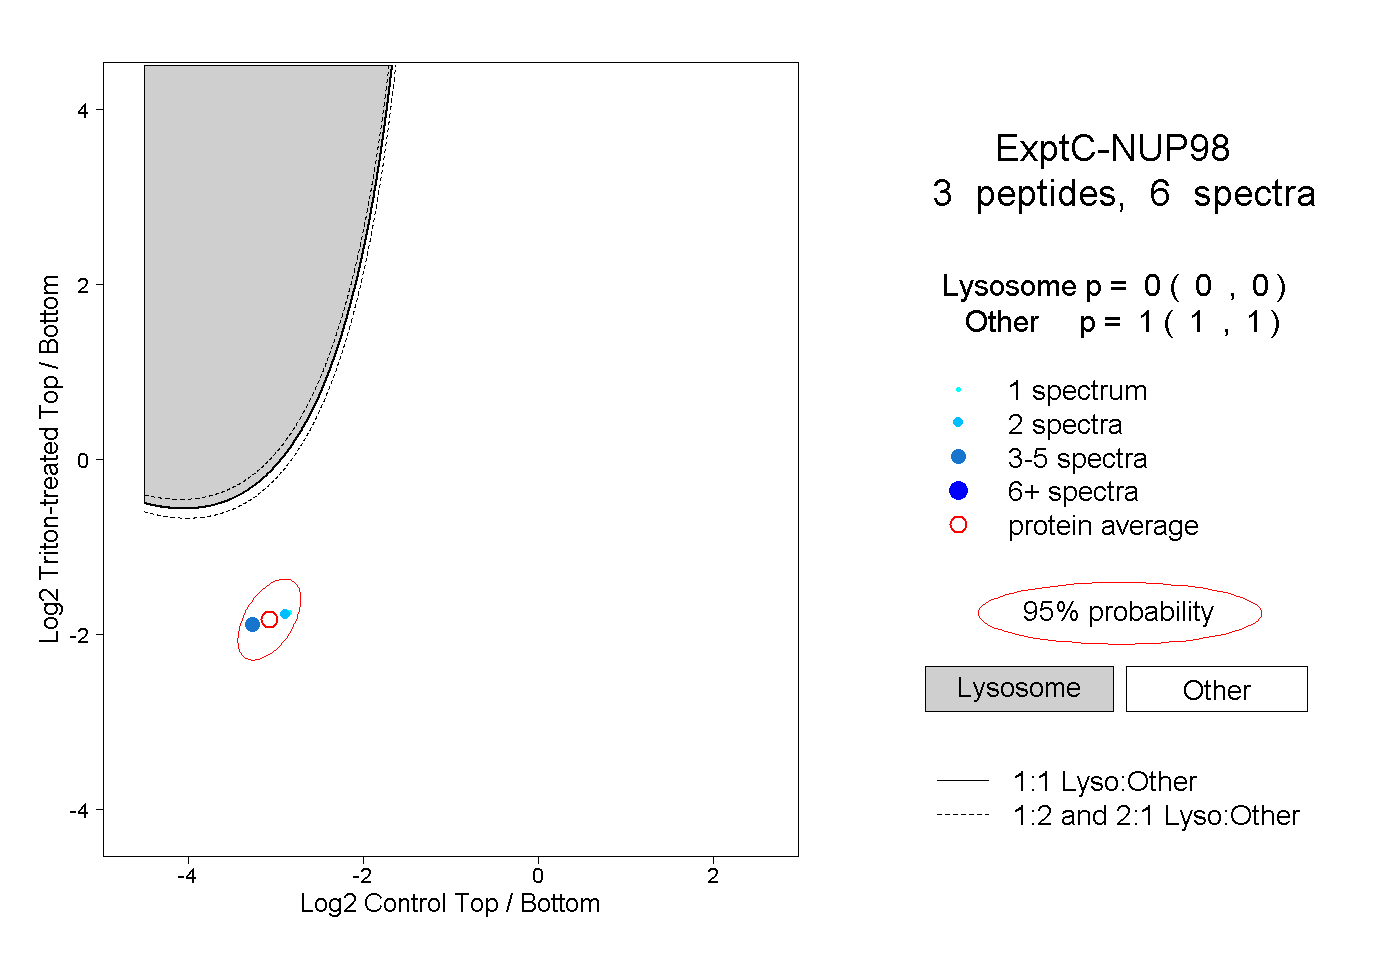 |
0.000 0.000 | 0.000 |
1.000 1.000 | 1.000 |