 16
16peptides
spectra
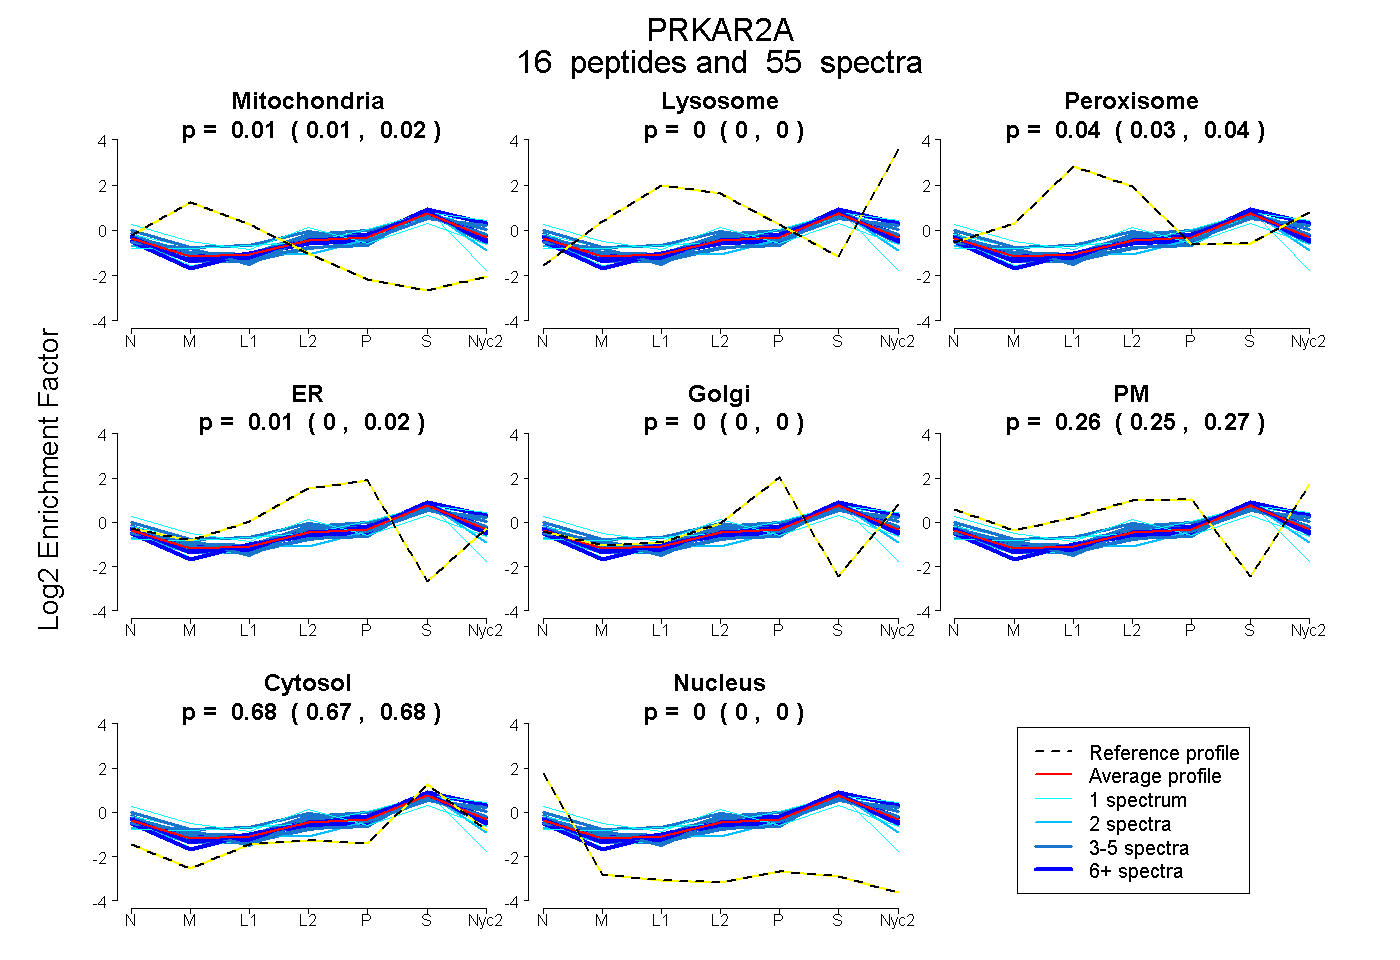
0.007 | 0.016
0.000 | 0.000
0.035 | 0.042
0.000 | 0.020
0.000 | 0.000
0.249 | 0.274
0.673 | 0.678
0.000 | 0.000
6peptides
spectra
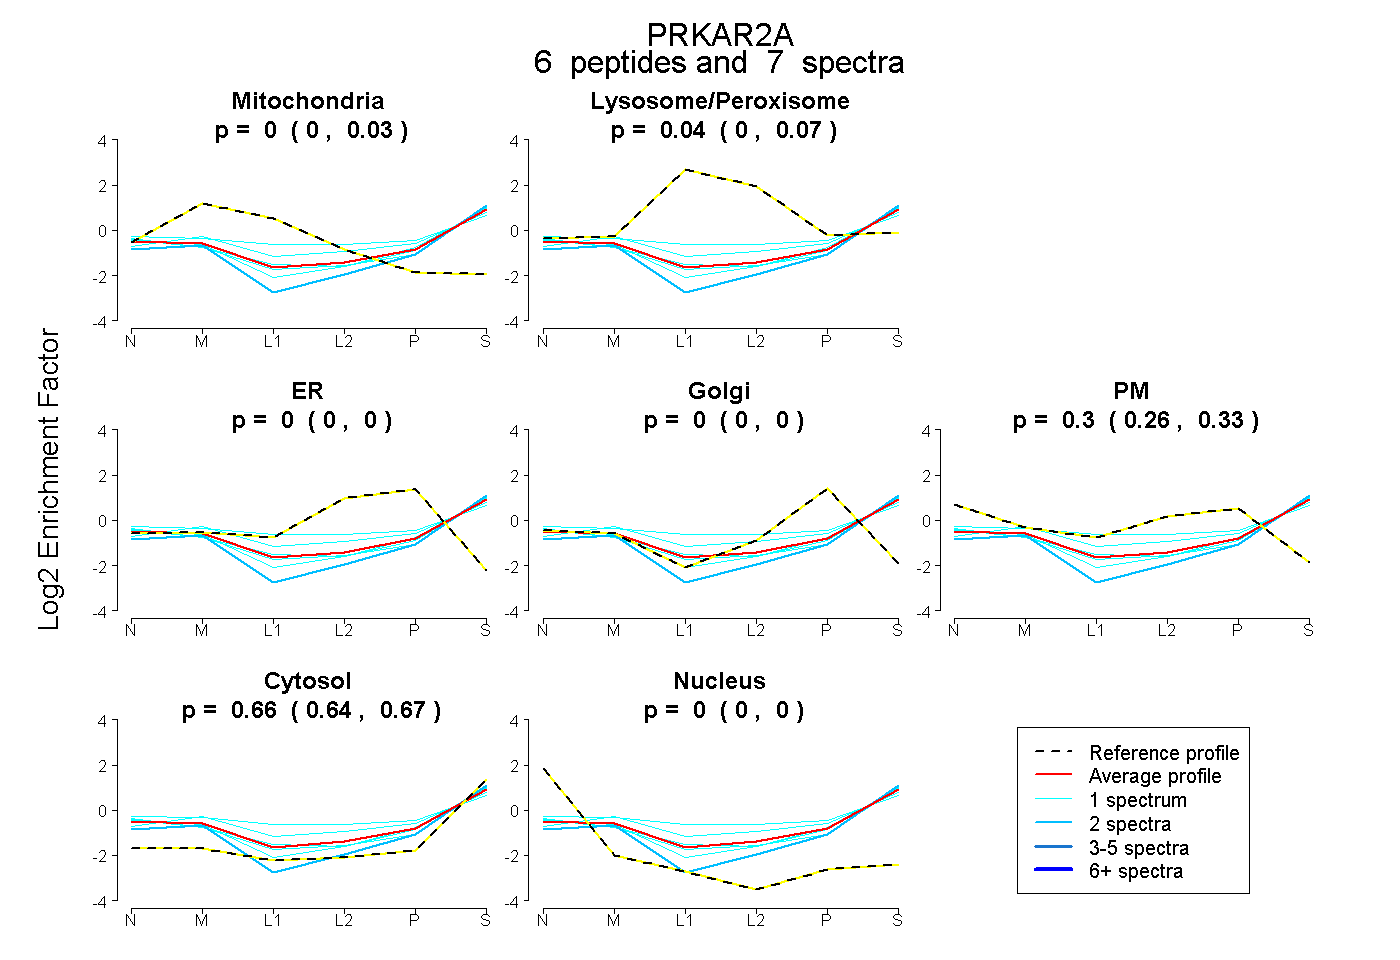
0.000 | 0.028
0.000 | 0.071
0.000 | 0.000
0.000 | 0.000
0.259 | 0.326
0.638 | 0.674
0.000 | 0.000
11peptides
spectra
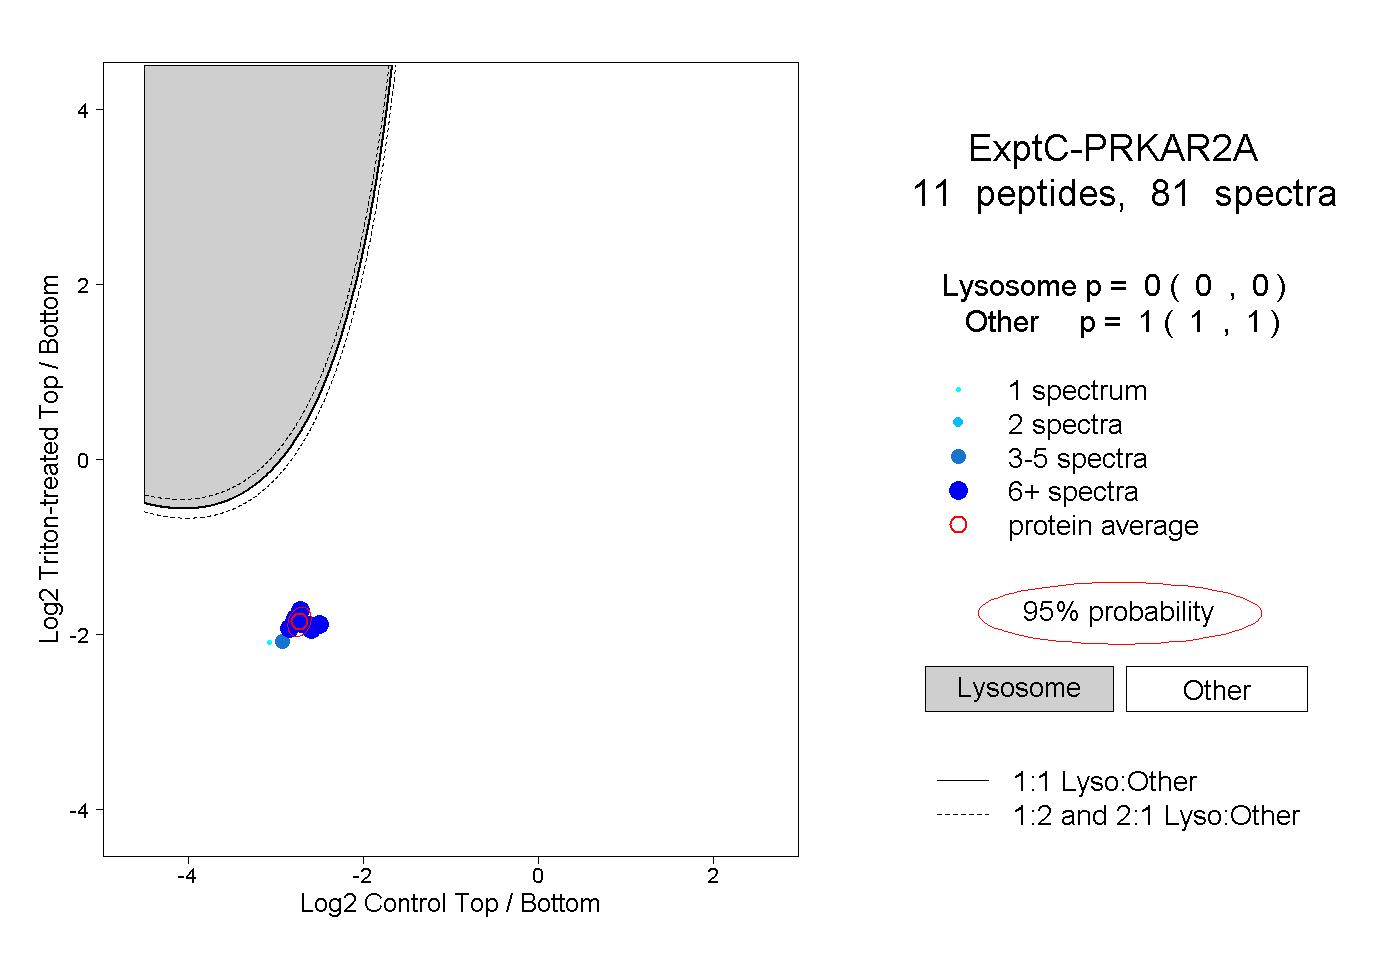
0.000 | 0.000
1.000 | 1.000
6peptides
spectra
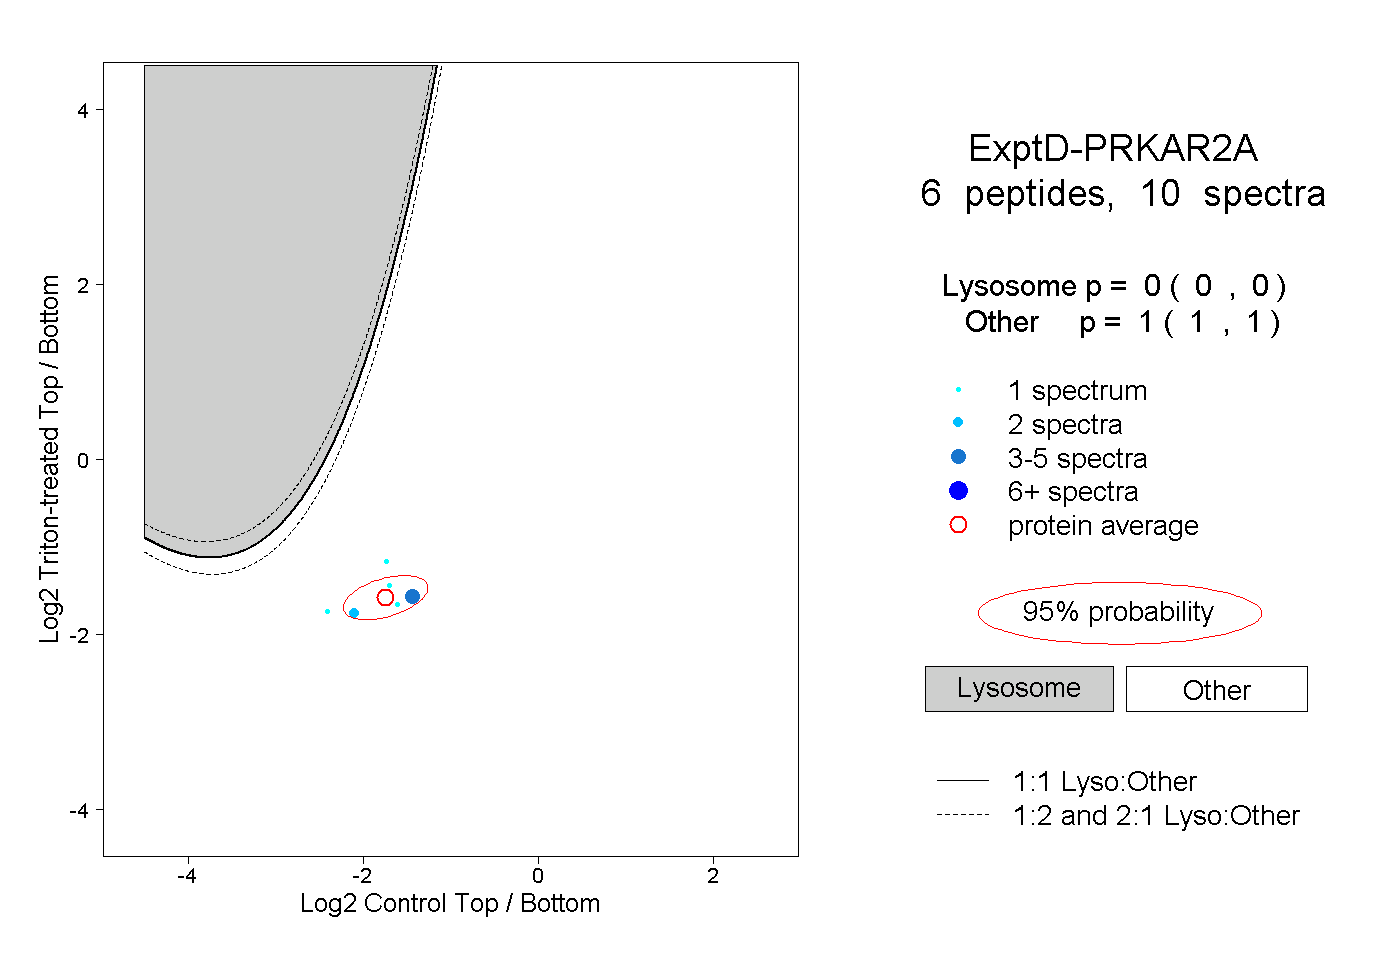
0.000 | 0.000
1.000 | 1.000