13
13peptides
spectra
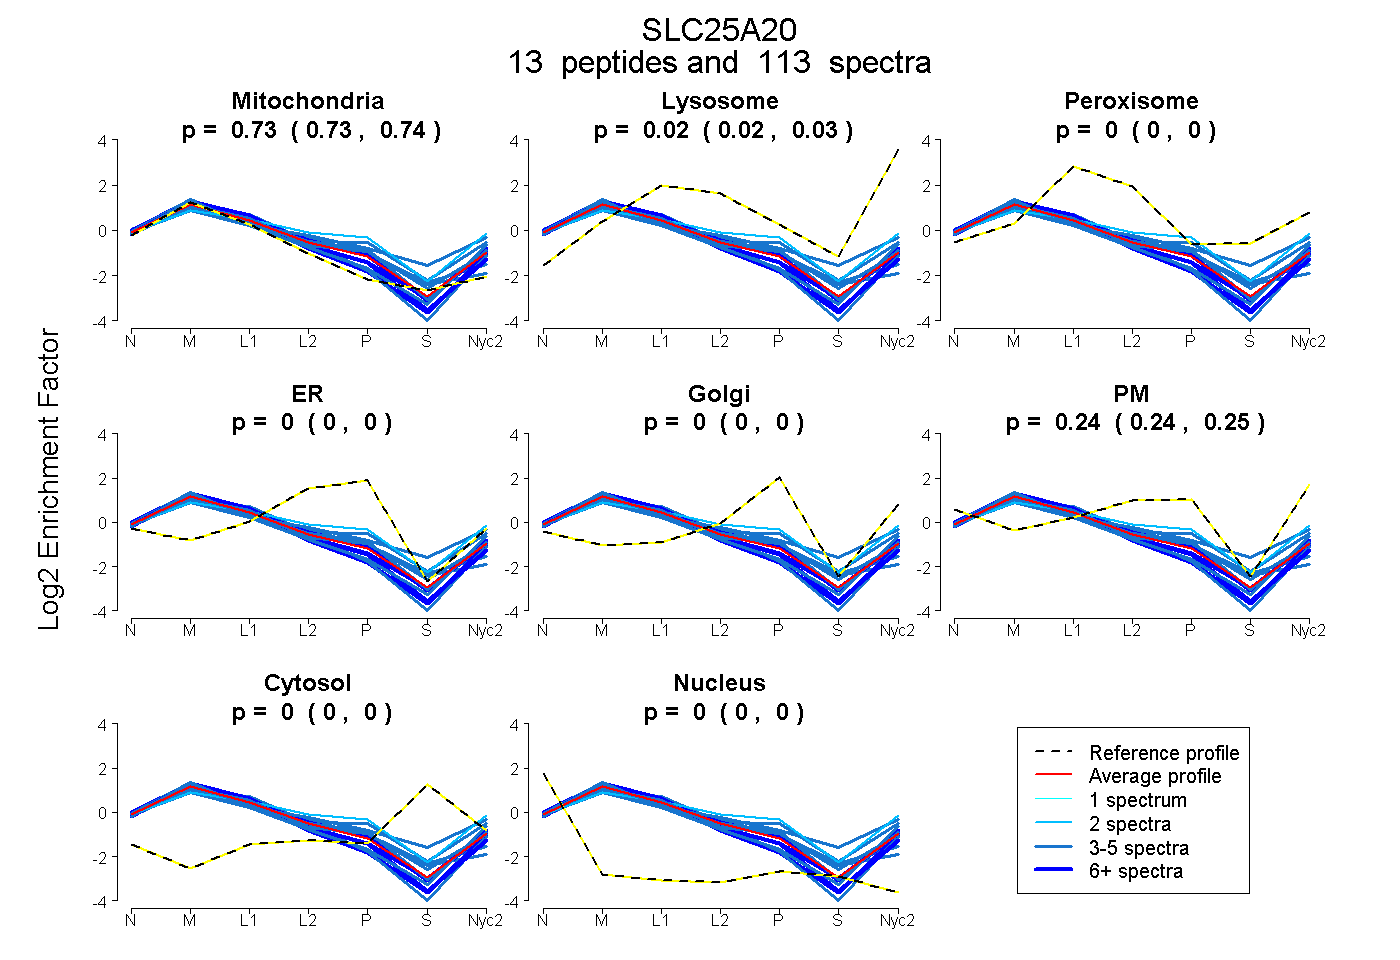
0.731 | 0.737
0.019 | 0.027
0.000 | 0.000
0.000 | 0.004
0.000 | 0.000
0.236 | 0.246
0.000 | 0.000
0.000 | 0.000
9peptides
spectra
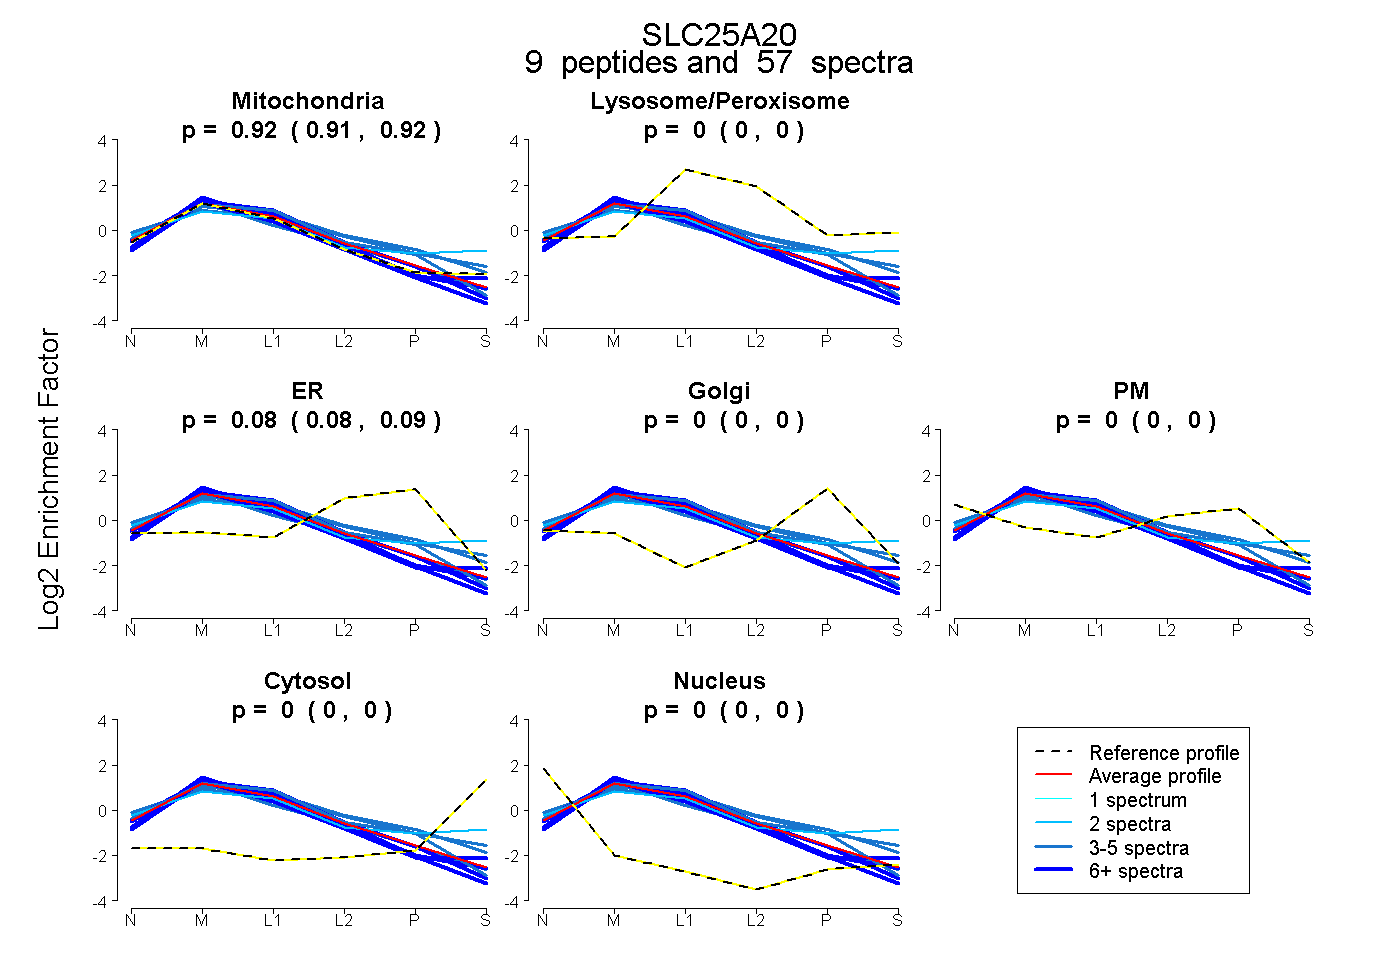
0.909 | 0.923
0.000 | 0.000
0.075 | 0.090
0.000 | 0.000
0.000 | 0.000
0.000 | 0.000
0.000 | 0.000