 13
13peptides
spectra
0.731 | 0.737
0.019 | 0.027
0.000 | 0.000
0.000 | 0.004
0.000 | 0.000
0.236 | 0.246
0.000 | 0.000
0.000 | 0.000
| Plot | Mito | Lyso | Perox | ER | Golgi | PM | Cytosol | Nucleus | |||||
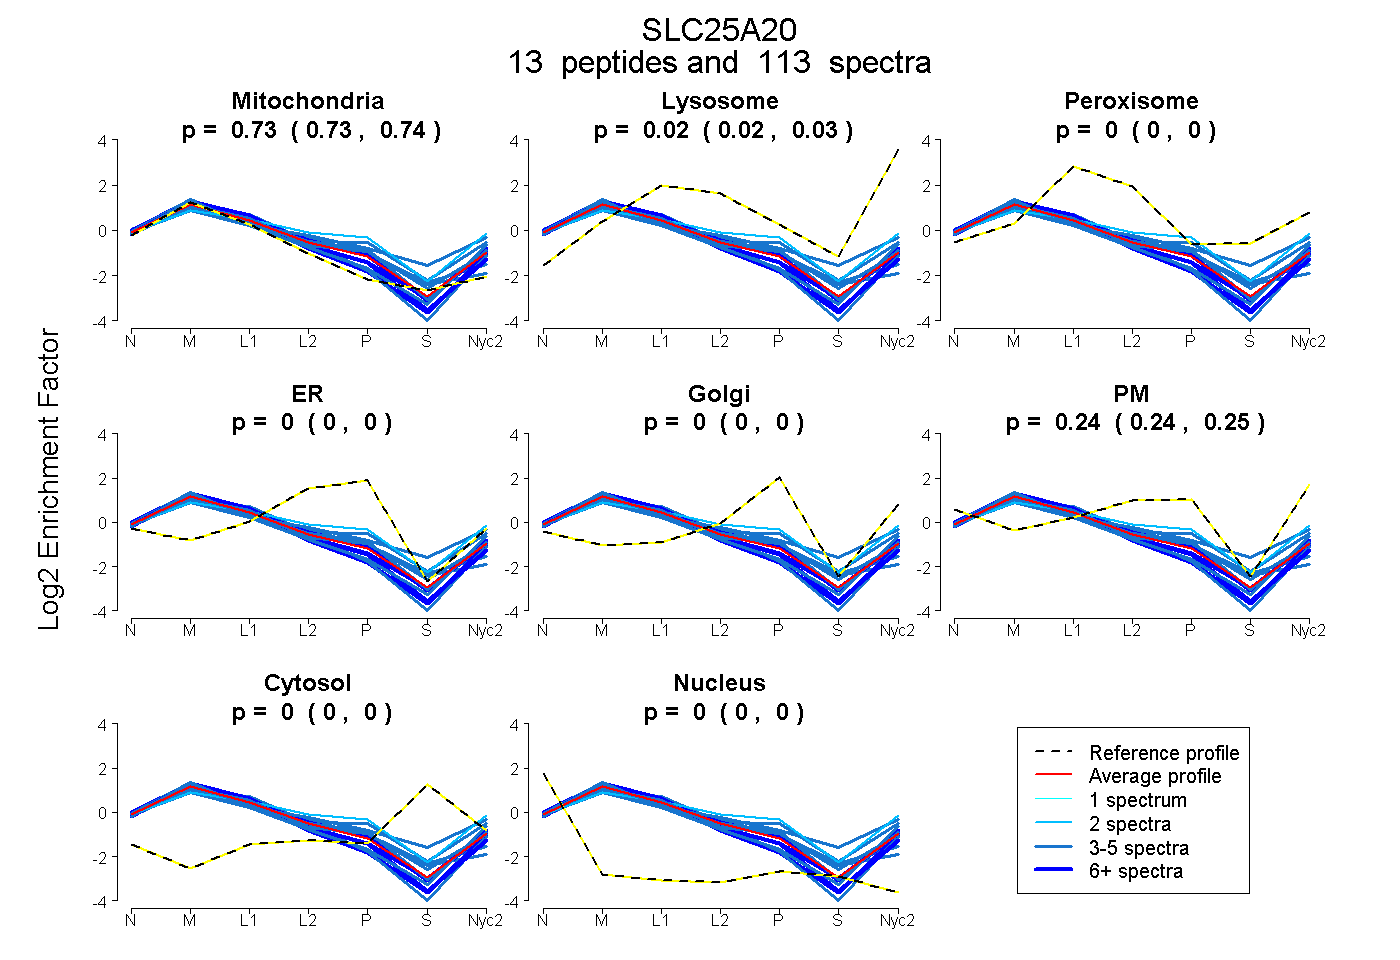
| Expt A |
13 peptides |
113 spectra |
|
0.734 0.731 | 0.737 |
0.023 0.019 | 0.027 |
0.000 0.000 | 0.000 |
0.000 0.000 | 0.004 |
0.000 0.000 | 0.000 |
0.243 0.236 | 0.246 |
0.000 0.000 | 0.000 |
0.000 0.000 | 0.000 |
| 5 spectra, NLFTPQGK | 0.520 | 0.105 | 0.046 | 0.000 | 0.000 | 0.236 | 0.093 | 0.000 | ||
| 41 spectra, GTVLTLMR | 0.777 | 0.068 | 0.000 | 0.000 | 0.000 | 0.155 | 0.000 | 0.000 | ||
| 3 spectra, DVPASGMYFMTYEWLK | 0.558 | 0.021 | 0.106 | 0.000 | 0.091 | 0.223 | 0.000 | 0.000 | ||
| 3 spectra, YSGTLDCAK | 0.711 | 0.034 | 0.017 | 0.000 | 0.055 | 0.183 | 0.000 | 0.000 | ||
| 3 spectra, FQTAPPGK | 0.828 | 0.000 | 0.000 | 0.000 | 0.000 | 0.172 | 0.000 | 0.000 | ||
| 9 spectra, EEGVTSLYK | 0.838 | 0.000 | 0.000 | 0.000 | 0.000 | 0.162 | 0.000 | 0.000 | ||
| 3 spectra, YPNGFR | 0.692 | 0.000 | 0.000 | 0.037 | 0.000 | 0.270 | 0.000 | 0.000 | ||
| 4 spectra, AFPANAACFLGFEIAMK | 0.722 | 0.000 | 0.076 | 0.173 | 0.029 | 0.000 | 0.000 | 0.000 | ||
| 4 spectra, CLLQIQASSGK | 0.771 | 0.000 | 0.013 | 0.217 | 0.000 | 0.000 | 0.000 | 0.000 | ||
| 15 spectra, EGITGLYR | 0.706 | 0.022 | 0.000 | 0.000 | 0.000 | 0.272 | 0.000 | 0.000 | ||
| 2 spectra, SVHDLSVPR | 0.500 | 0.116 | 0.028 | 0.014 | 0.079 | 0.264 | 0.000 | 0.000 | ||
| 18 spectra, GFNAVMIR | 0.816 | 0.000 | 0.000 | 0.005 | 0.000 | 0.179 | 0.000 | 0.000 | ||
| 3 spectra, LYQEFGIR | 0.780 | 0.056 | 0.000 | 0.000 | 0.000 | 0.163 | 0.000 | 0.000 |
| Plot | Mito | Lyso or Perox | ER | Golgi | PM | Cytosol | Nucleus | ||||||
| Expt B |
9 peptides |
57 spectra |
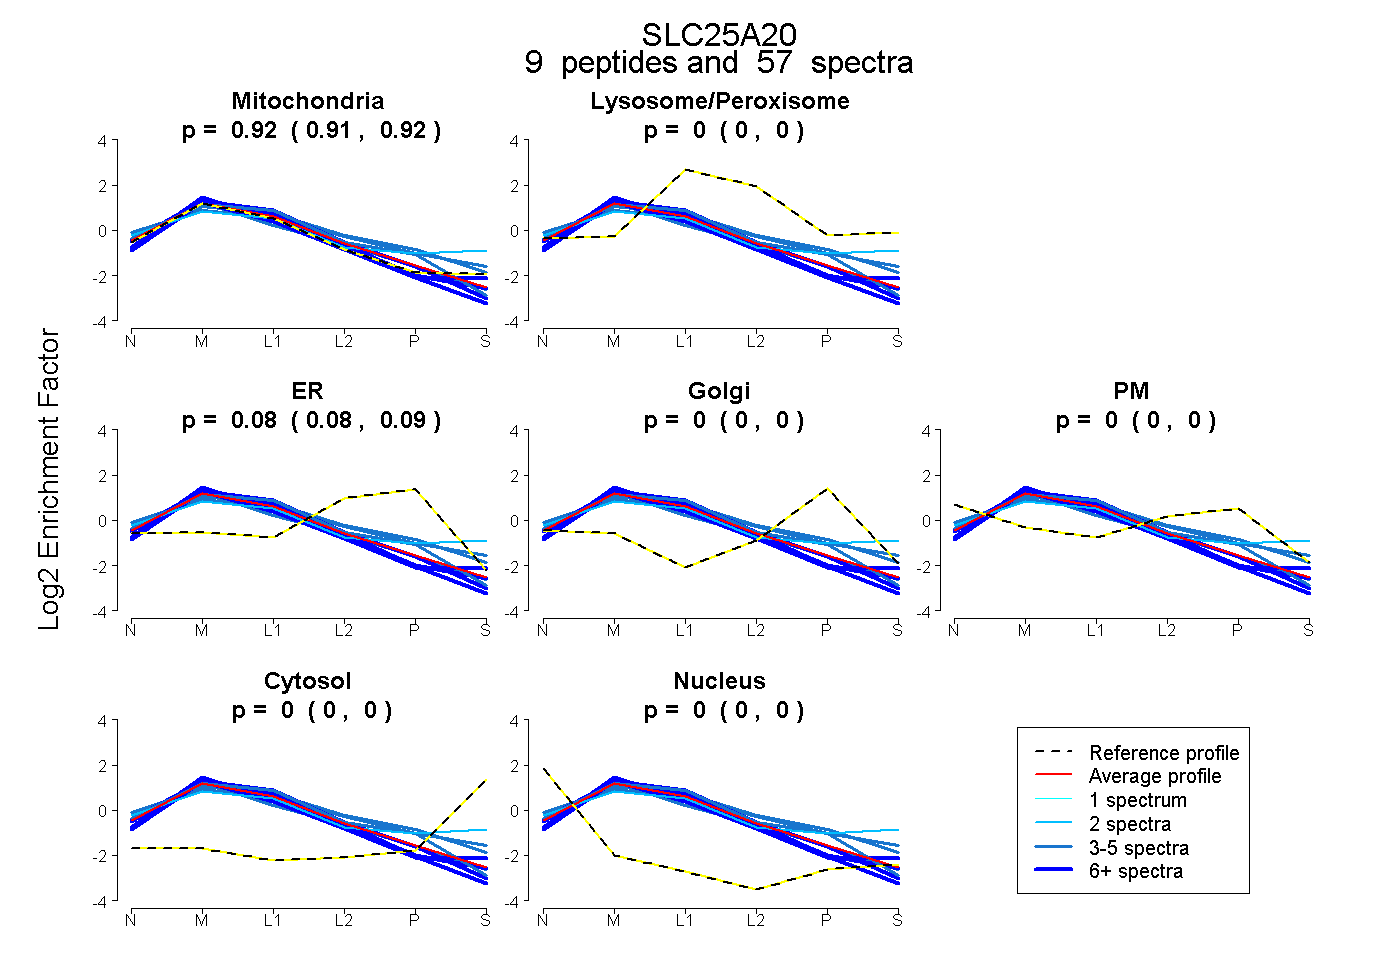 |
0.917 0.909 | 0.923 |
0.000 0.000 | 0.000 |
0.083 0.075 | 0.090 |
0.000 0.000 | 0.000 |
0.000 0.000 | 0.000 |
0.000 0.000 | 0.000 |
0.000 0.000 | 0.000 |
|||
| Plot | Lyso | Other | |||||||||||
| Expt C |
14 peptides |
439 spectra |
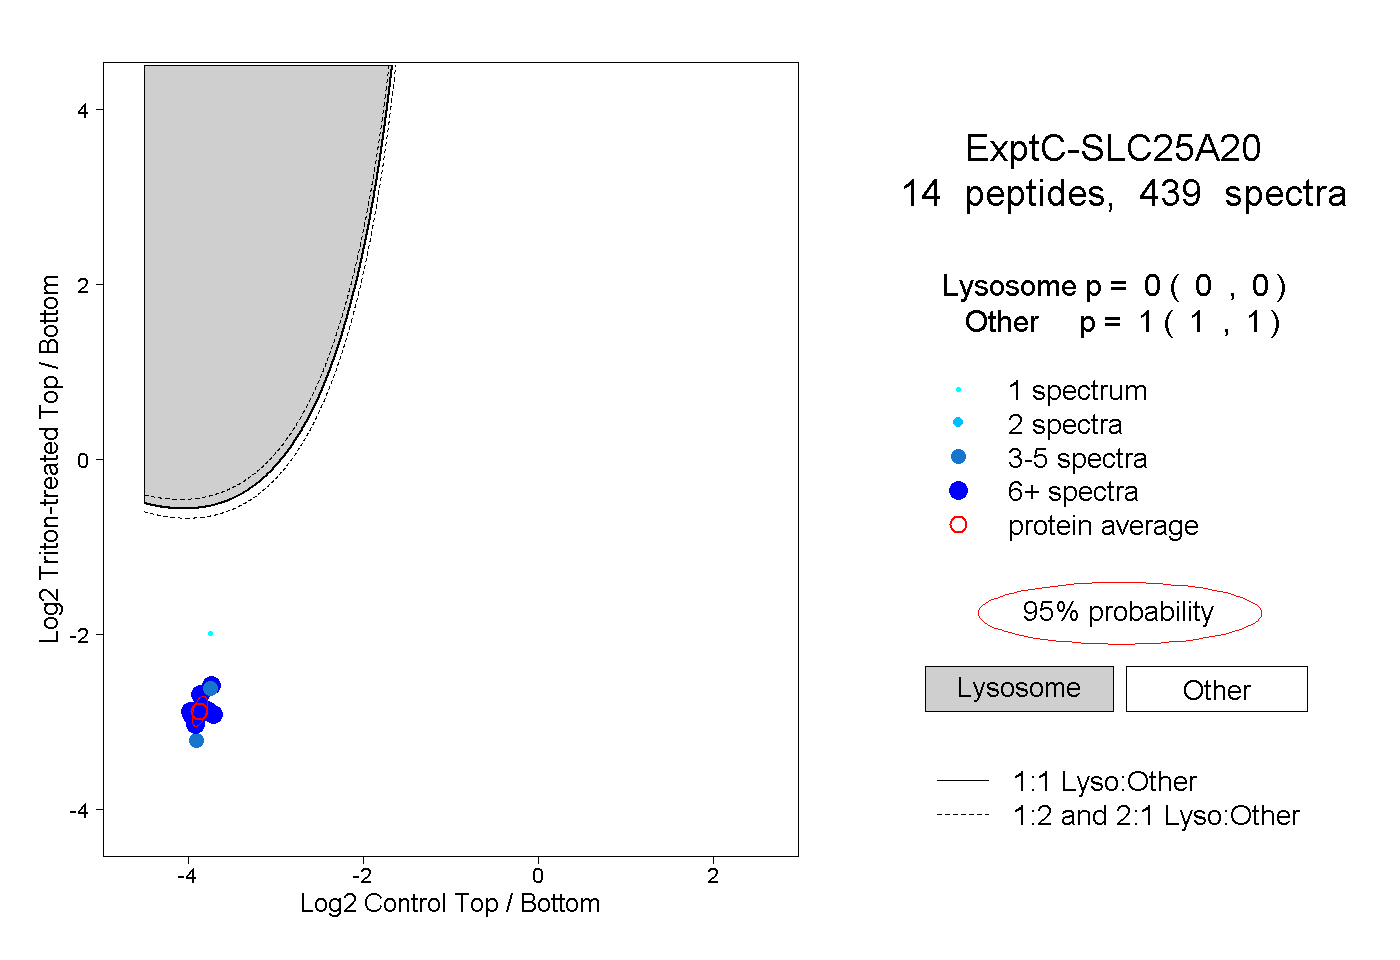 |
0.000 0.000 | 0.000 |
1.000 1.000 | 1.000 |
||||||||
| Plot | Lyso | Other | |||||||||||
| Expt D |
7 peptides |
33 spectra |
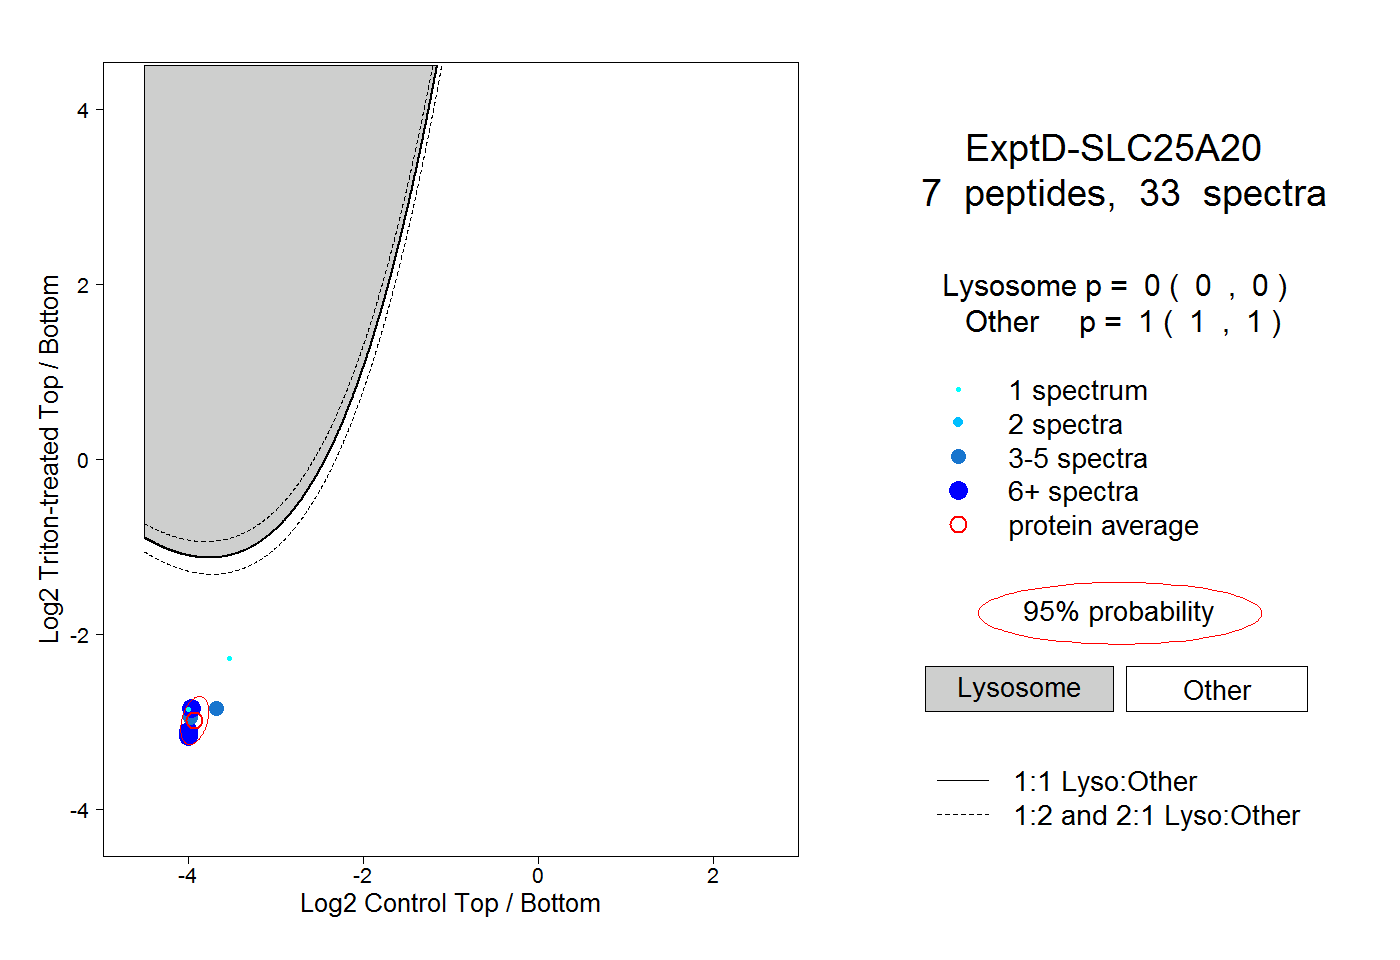 |
0.000 0.000 | 0.000 |
1.000 1.000 | 1.000 |