 13
13peptides
spectra
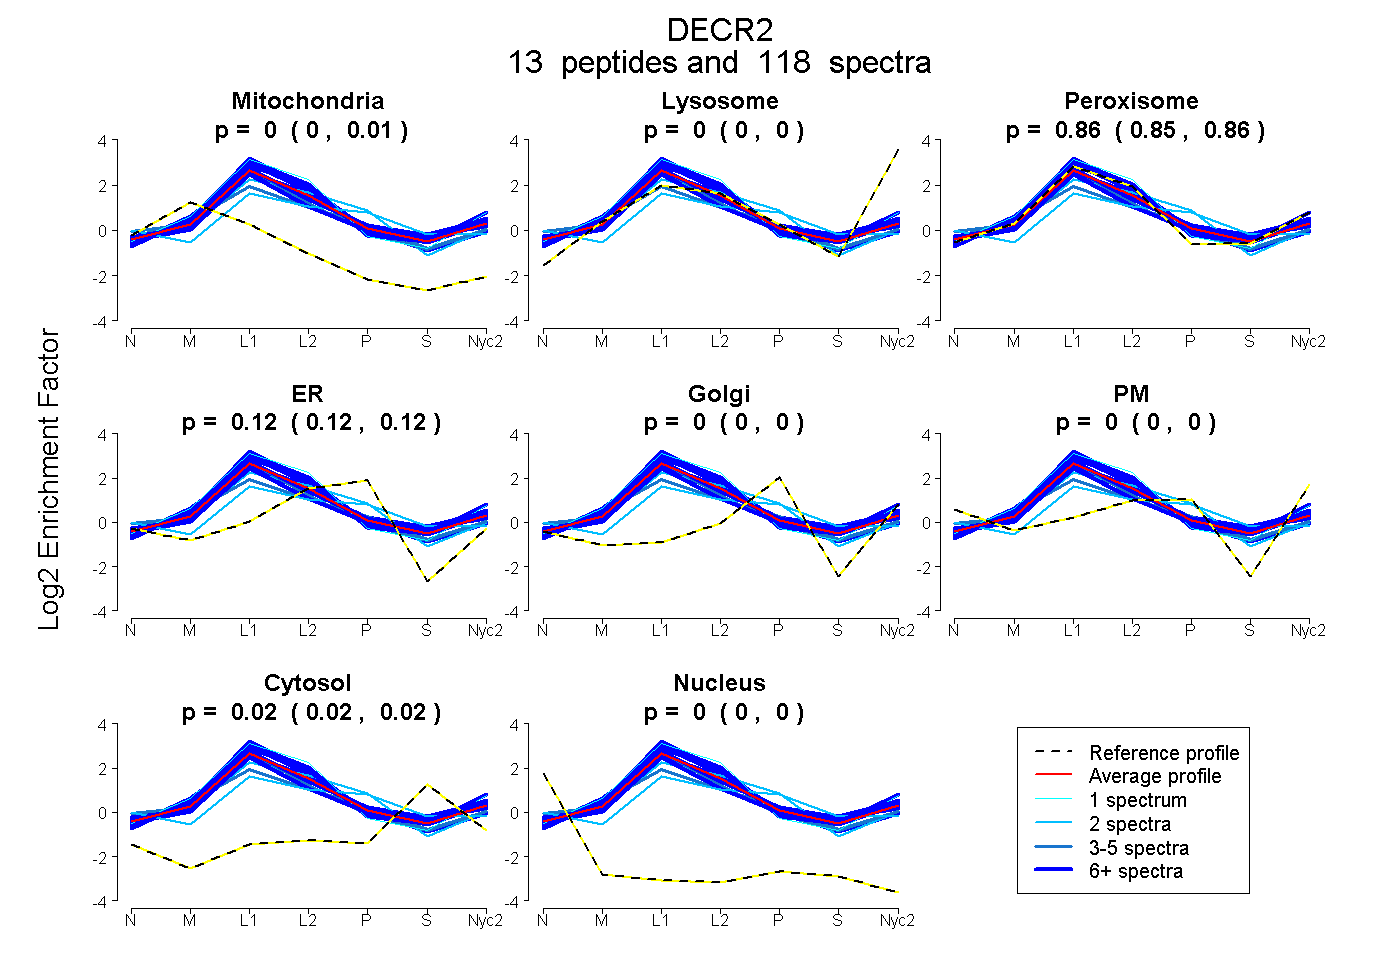
0.001 | 0.006
0.000 | 0.000
0.854 | 0.861
0.117 | 0.123
0.000 | 0.000
0.000 | 0.000
0.016 | 0.020
0.000 | 0.000
12peptides
spectra
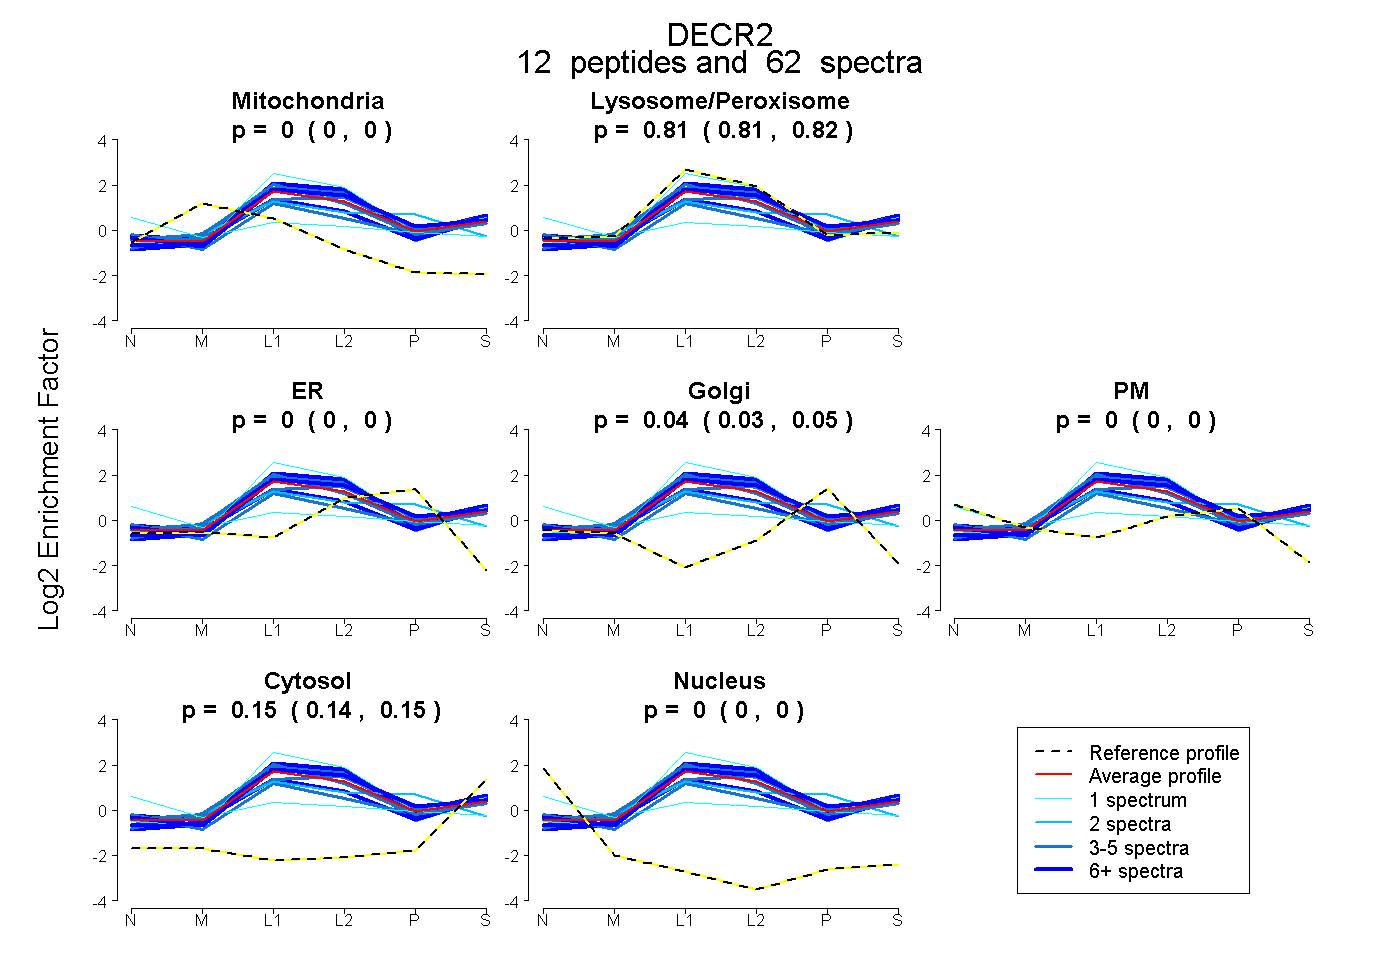
0.000 | 0.000
0.807 | 0.816
0.000 | 0.000
0.035 | 0.045
0.000 | 0.000
0.143 | 0.152
0.000 | 0.000
15peptides
spectra
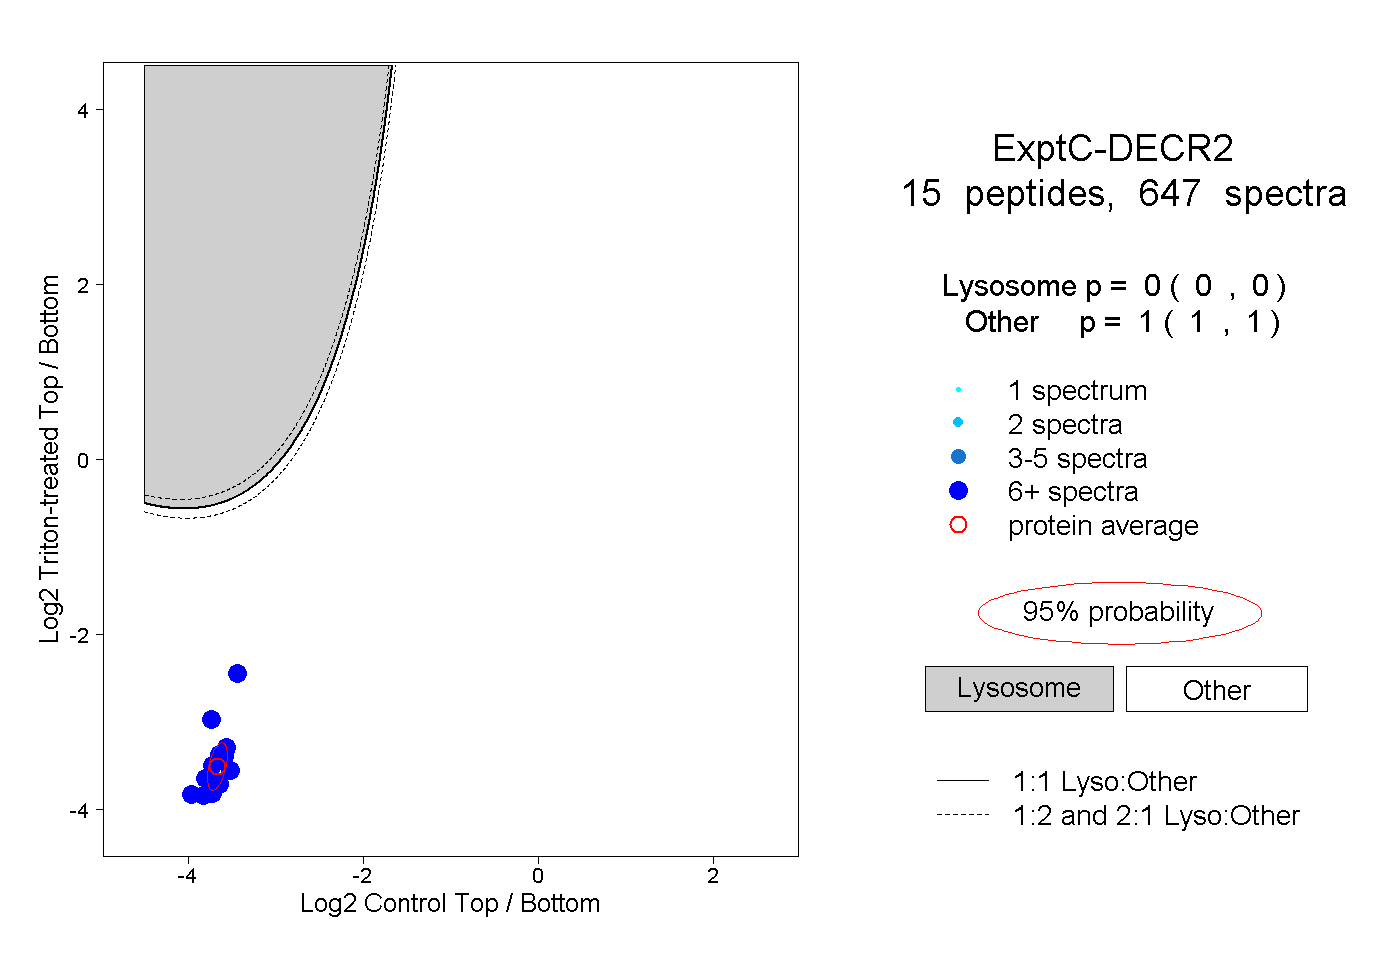
0.000 | 0.000
1.000 | 1.000
9peptides
spectra
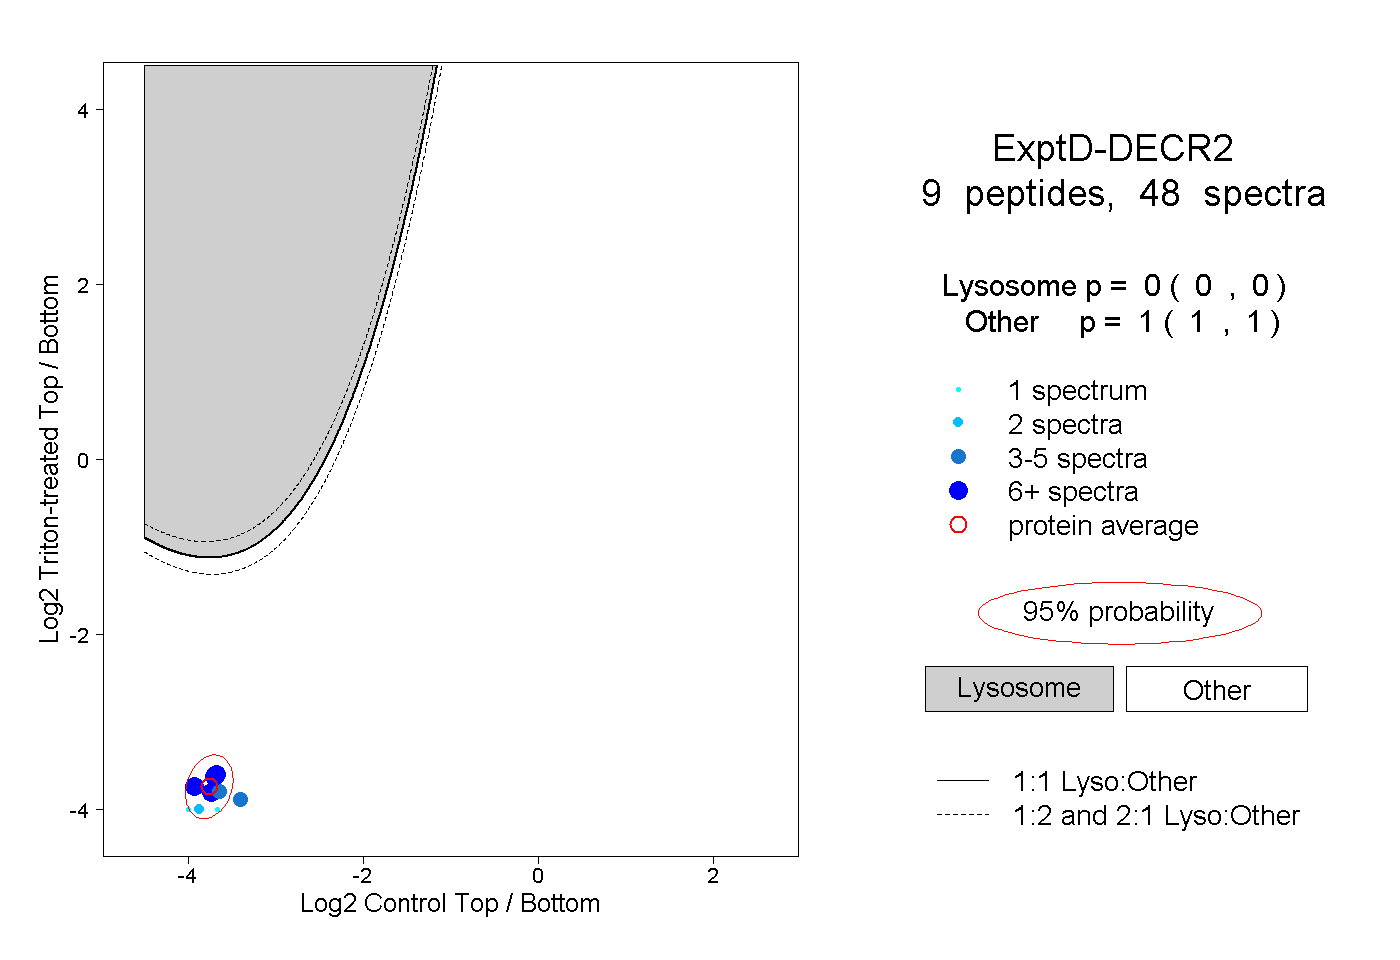
0.000 | 0.000
1.000 | 1.000