 13
13peptides
spectra
0.001 | 0.006
0.000 | 0.000
0.854 | 0.861
0.117 | 0.123
0.000 | 0.000
0.000 | 0.000
0.016 | 0.020
0.000 | 0.000
| Plot | Mito | Lyso | Perox | ER | Golgi | PM | Cytosol | Nucleus | |||||
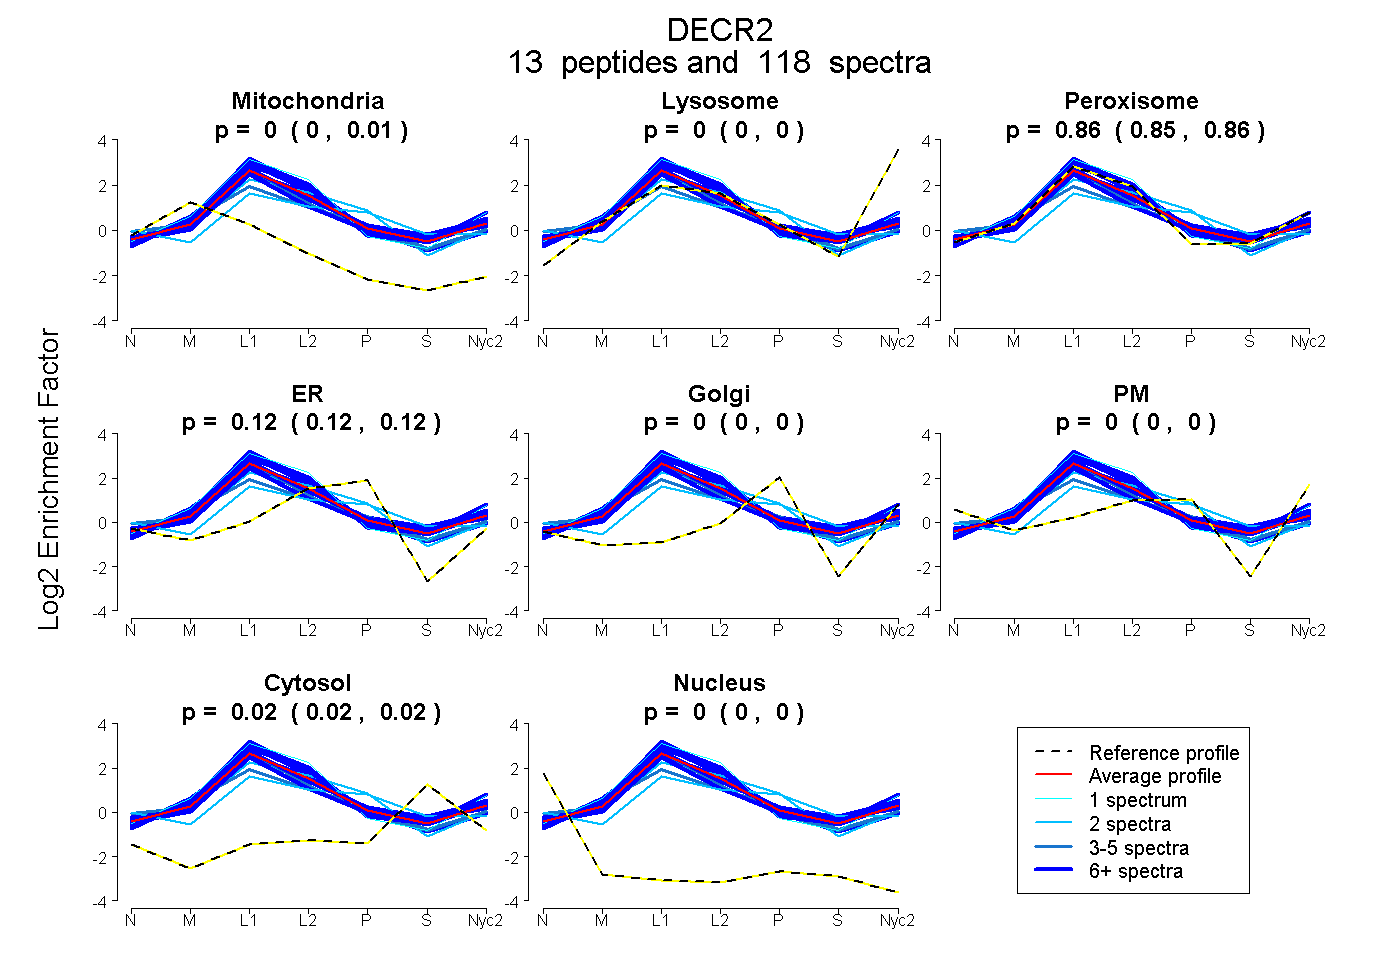
| Expt A |
13 peptides |
118 spectra |
|
0.004 0.001 | 0.006 |
0.000 0.000 | 0.000 |
0.858 0.854 | 0.861 |
0.120 0.117 | 0.123 |
0.000 0.000 | 0.000 |
0.000 0.000 | 0.000 |
0.018 0.016 | 0.020 |
0.000 0.000 | 0.000 |
| 10 spectra, GQVLQLHAGAAK | 0.000 | 0.000 | 0.802 | 0.126 | 0.000 | 0.000 | 0.072 | 0.000 | ||
| 17 spectra, IAEIFMR | 0.000 | 0.000 | 0.933 | 0.067 | 0.000 | 0.000 | 0.000 | 0.000 | ||
| 7 spectra, TVVDIDTLGTFNVSR | 0.000 | 0.000 | 1.000 | 0.000 | 0.000 | 0.000 | 0.000 | 0.000 | ||
| 17 spectra, YLSSPIPR | 0.000 | 0.000 | 0.880 | 0.024 | 0.081 | 0.000 | 0.014 | 0.000 | ||
| 2 spectra, VSEAAK | 0.000 | 0.000 | 0.523 | 0.309 | 0.000 | 0.000 | 0.168 | 0.000 | ||
| 10 spectra, VAFITGGGSGIGFR | 0.000 | 0.013 | 0.987 | 0.000 | 0.000 | 0.000 | 0.000 | 0.000 | ||
| 30 spectra, AAVDAMTR | 0.000 | 0.000 | 0.944 | 0.046 | 0.000 | 0.000 | 0.011 | 0.000 | ||
| 6 spectra, VPPAVMAAVDQALK | 0.000 | 0.000 | 0.833 | 0.000 | 0.081 | 0.000 | 0.086 | 0.000 | ||
| 6 spectra, CLPLSMDVR | 0.083 | 0.000 | 0.789 | 0.128 | 0.000 | 0.000 | 0.000 | 0.000 | ||
| 5 spectra, LLEFESSSAK | 0.073 | 0.000 | 0.814 | 0.092 | 0.000 | 0.000 | 0.000 | 0.021 | ||
| 2 spectra, HGCHTVIVSR | 0.000 | 0.000 | 0.641 | 0.359 | 0.000 | 0.000 | 0.000 | 0.000 | ||
| 5 spectra, HLAVEWGPQNIR | 0.111 | 0.000 | 0.662 | 0.100 | 0.117 | 0.000 | 0.010 | 0.000 | ||
| 1 spectrum, VNSLAPGAISGTEGLR | 0.000 | 0.003 | 0.996 | 0.002 | 0.000 | 0.000 | 0.000 | 0.000 |
| Plot | Mito | Lyso or Perox | ER | Golgi | PM | Cytosol | Nucleus | ||||||
| Expt B |
12 peptides |
62 spectra |
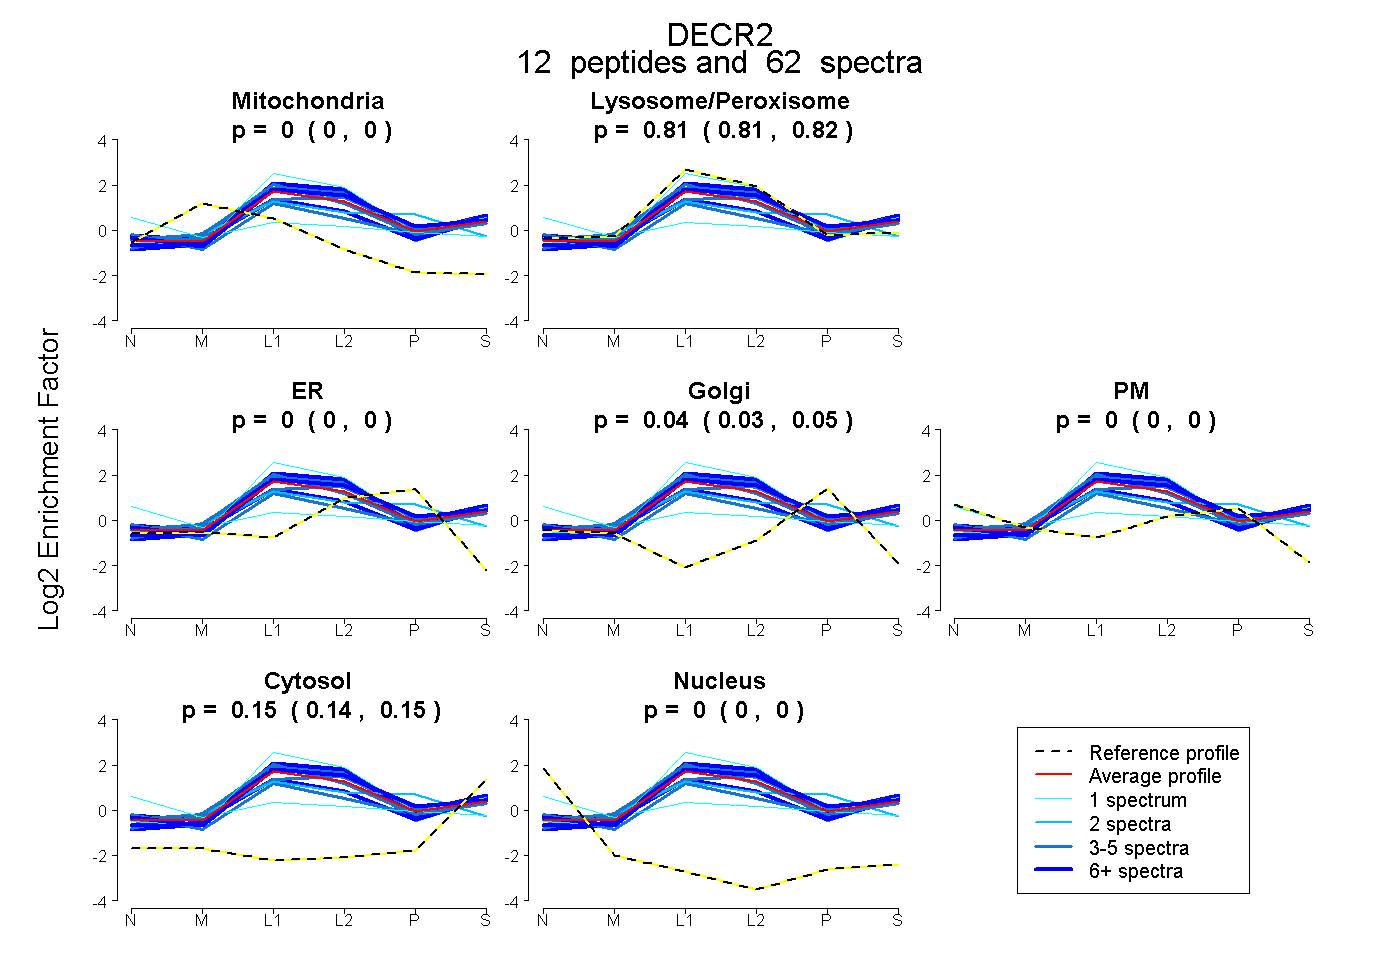 |
0.000 0.000 | 0.000 |
0.811 0.807 | 0.816 |
0.000 0.000 | 0.000 |
0.041 0.035 | 0.045 |
0.000 0.000 | 0.000 |
0.148 0.143 | 0.152 |
0.000 0.000 | 0.000 |
|||
| Plot | Lyso | Other | |||||||||||
| Expt C |
15 peptides |
647 spectra |
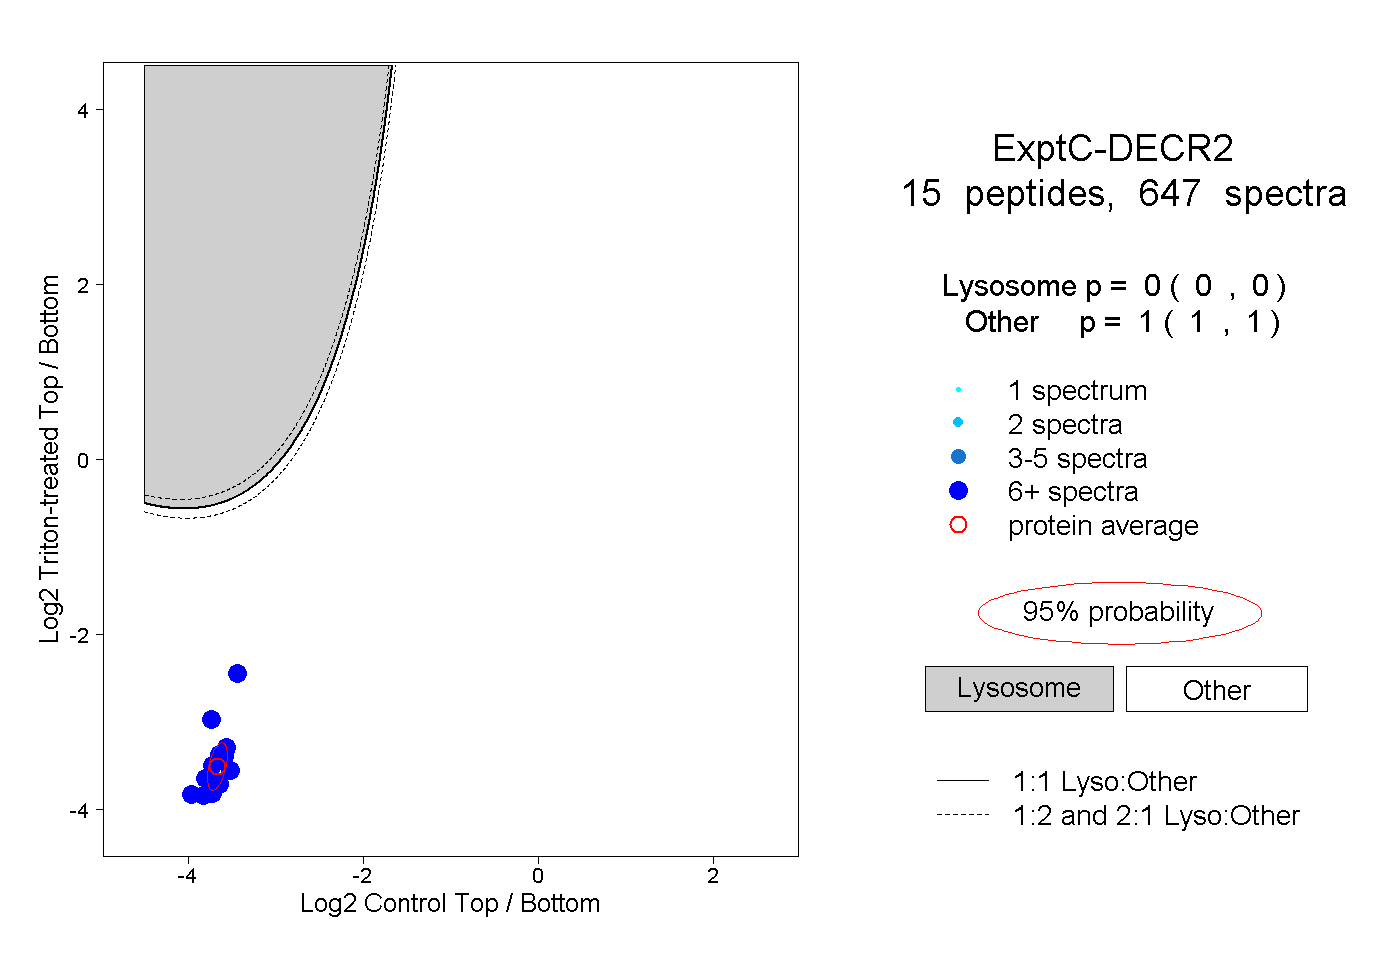 |
0.000 0.000 | 0.000 |
1.000 1.000 | 1.000 |
||||||||
| Plot | Lyso | Other | |||||||||||
| Expt D |
9 peptides |
48 spectra |
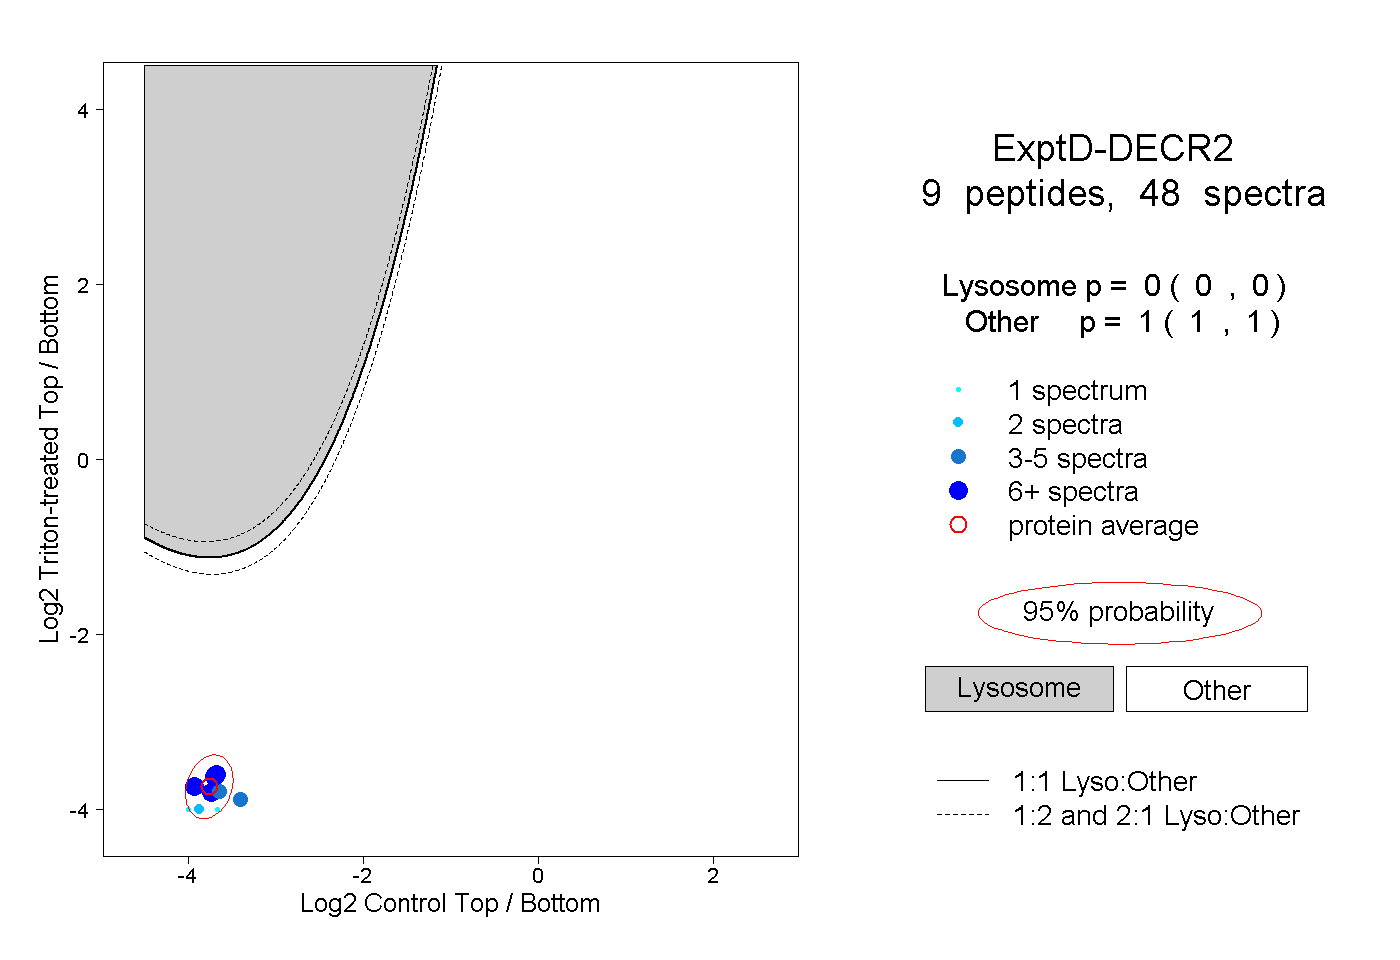 |
0.000 0.000 | 0.000 |
1.000 1.000 | 1.000 |