14
14peptides
spectra
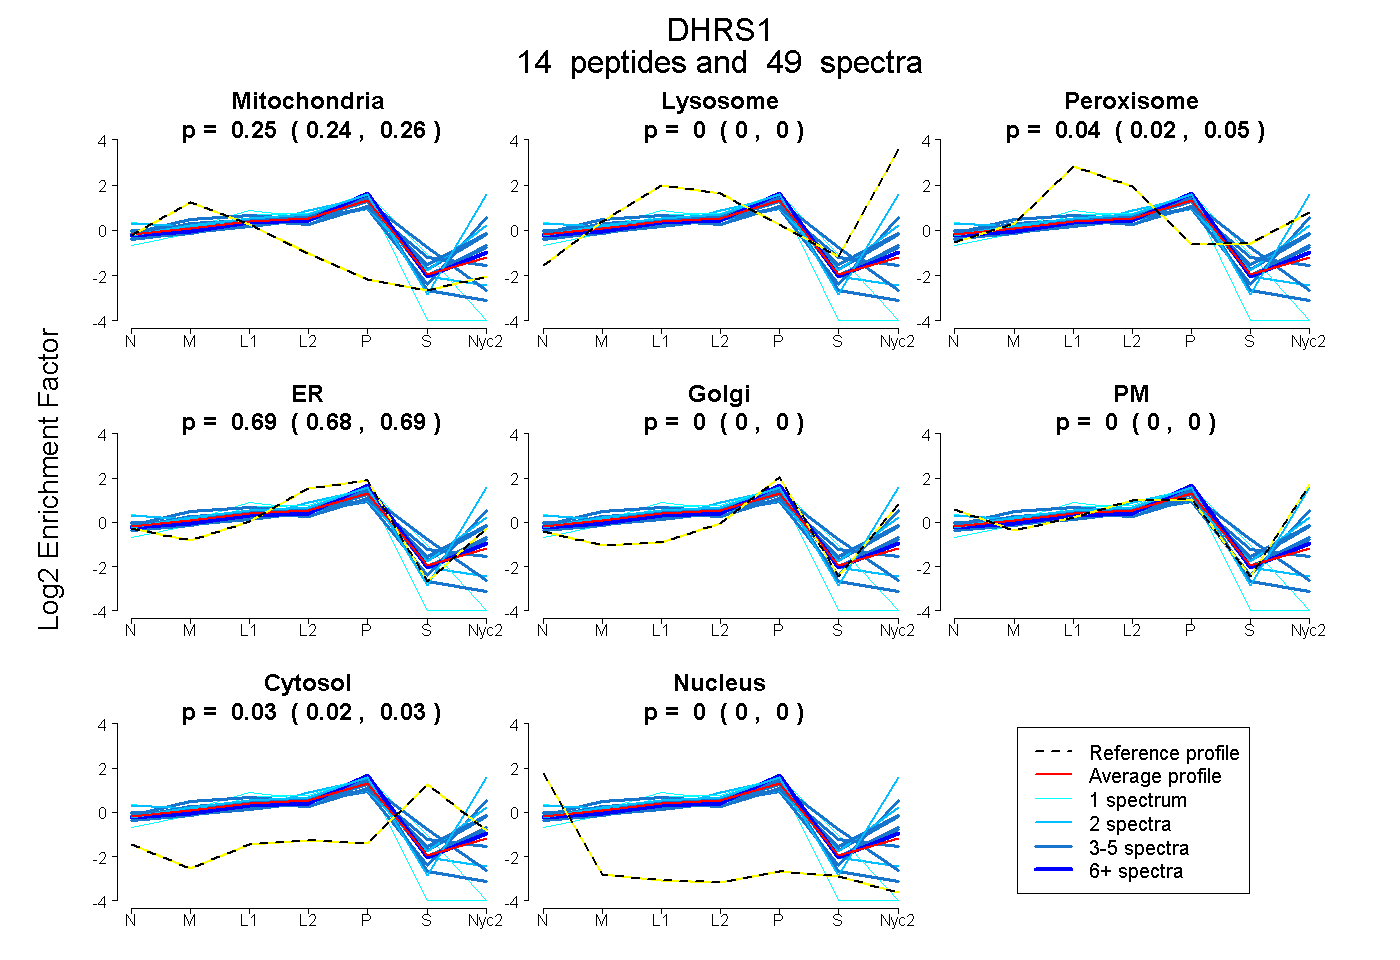
0.238 | 0.261
0.000 | 0.000
0.023 | 0.046
0.679 | 0.692
0.000 | 0.000
0.000 | 0.000
0.022 | 0.033
0.000 | 0.000
10peptides
spectra
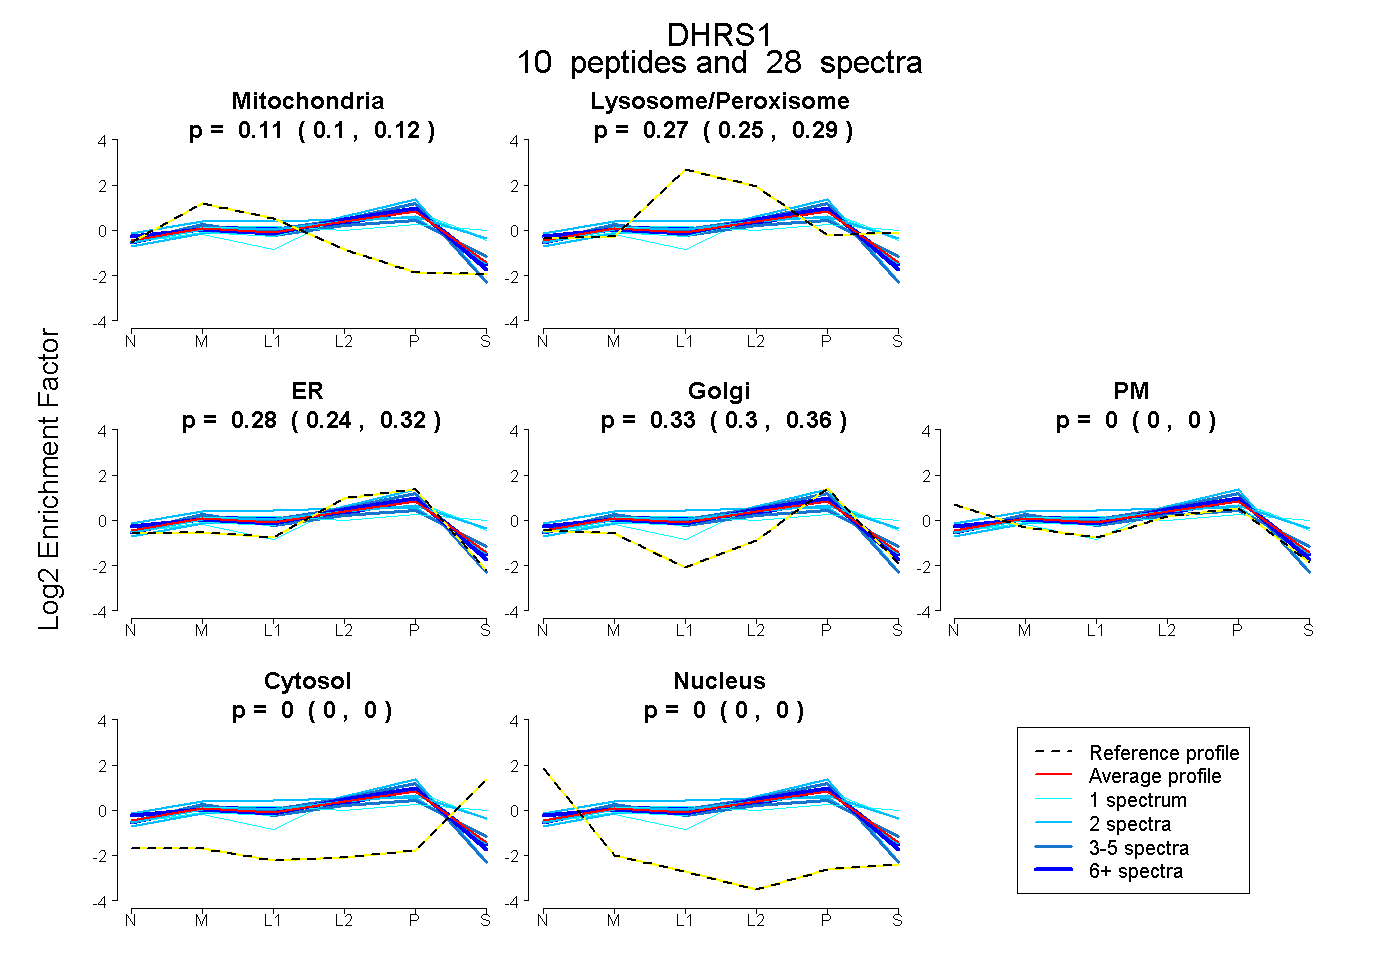
0.097 | 0.125
0.247 | 0.289
0.243 | 0.320
0.298 | 0.360
0.000 | 0.000
0.000 | 0.000
0.000 | 0.000