 14
14peptides
spectra
0.238 | 0.261
0.000 | 0.000
0.023 | 0.046
0.679 | 0.692
0.000 | 0.000
0.000 | 0.000
0.022 | 0.033
0.000 | 0.000
| Plot | Mito | Lyso | Perox | ER | Golgi | PM | Cytosol | Nucleus | |||||
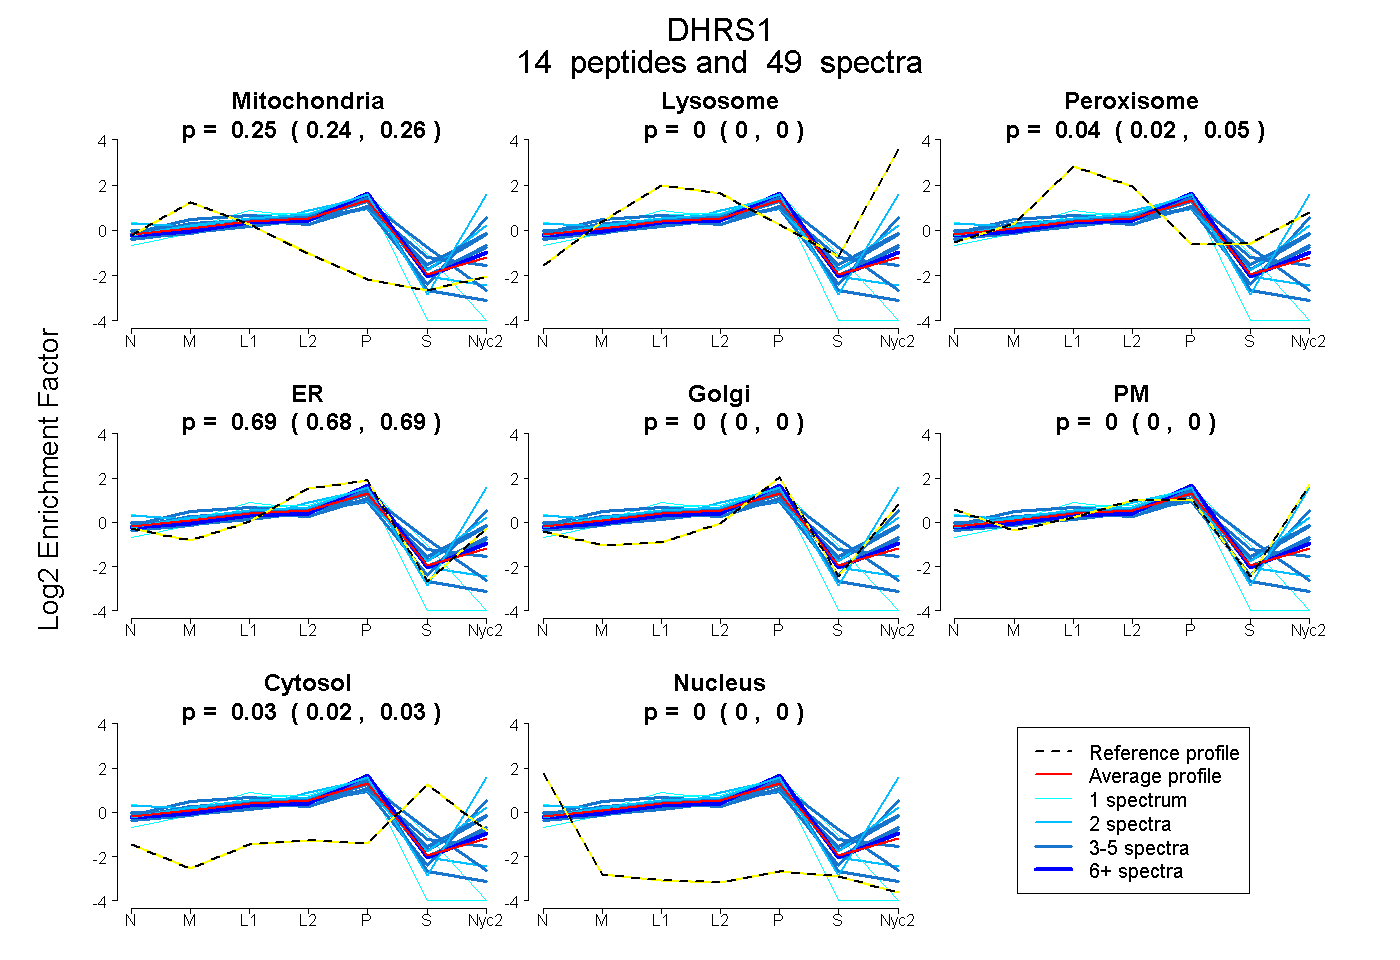
| Expt A |
14 peptides |
49 spectra |
|
0.250 0.238 | 0.261 |
0.000 0.000 | 0.000 |
0.035 0.023 | 0.046 |
0.686 0.679 | 0.692 |
0.000 0.000 | 0.000 |
0.000 0.000 | 0.000 |
0.028 0.022 | 0.033 |
0.000 0.000 | 0.000 |
| 5 spectra, LAADCAHELR | 0.245 | 0.000 | 0.000 | 0.556 | 0.000 | 0.000 | 0.200 | 0.000 | ||
| 4 spectra, GHYLCSVYGAR | 0.223 | 0.167 | 0.000 | 0.263 | 0.064 | 0.282 | 0.000 | 0.000 | ||
| 4 spectra, SLFEQVDR | 0.187 | 0.000 | 0.257 | 0.115 | 0.440 | 0.000 | 0.000 | 0.000 | ||
| 6 spectra, VLPSCDLAR | 0.205 | 0.000 | 0.011 | 0.675 | 0.092 | 0.000 | 0.017 | 0.000 | ||
| 1 spectrum, DVDGRPVQDYFSLGYALSQVSSLR | 0.355 | 0.000 | 0.000 | 0.572 | 0.000 | 0.000 | 0.000 | 0.074 | ||
| 3 spectra, SVLSSAETTEMSGK | 0.213 | 0.000 | 0.071 | 0.562 | 0.000 | 0.000 | 0.154 | 0.000 | ||
| 5 spectra, LMVPAGK | 0.139 | 0.000 | 0.216 | 0.324 | 0.321 | 0.000 | 0.000 | 0.000 | ||
| 1 spectrum, CVVALATDPNILSLSGK | 0.299 | 0.000 | 0.000 | 0.590 | 0.000 | 0.000 | 0.110 | 0.000 | ||
| 4 spectra, EEQPEDPLFK | 0.216 | 0.000 | 0.074 | 0.569 | 0.141 | 0.000 | 0.000 | 0.000 | ||
| 2 spectra, WIVTLYTSK | 0.022 | 0.174 | 0.000 | 0.123 | 0.201 | 0.480 | 0.000 | 0.000 | ||
| 2 spectra, CVPVVCDSSQESEVK | 0.308 | 0.000 | 0.000 | 0.692 | 0.000 | 0.000 | 0.000 | 0.000 | ||
| 2 spectra, MIMTMK | 0.167 | 0.000 | 0.183 | 0.120 | 0.288 | 0.241 | 0.000 | 0.000 | ||
| 5 spectra, GQVCVVTGASR | 0.301 | 0.000 | 0.000 | 0.646 | 0.000 | 0.000 | 0.000 | 0.052 | ||
| 5 spectra, ATAQEAQSLGGR | 0.183 | 0.000 | 0.072 | 0.636 | 0.104 | 0.000 | 0.005 | 0.000 |
| Plot | Mito | Lyso or Perox | ER | Golgi | PM | Cytosol | Nucleus | ||||||
| Expt B |
10 peptides |
28 spectra |
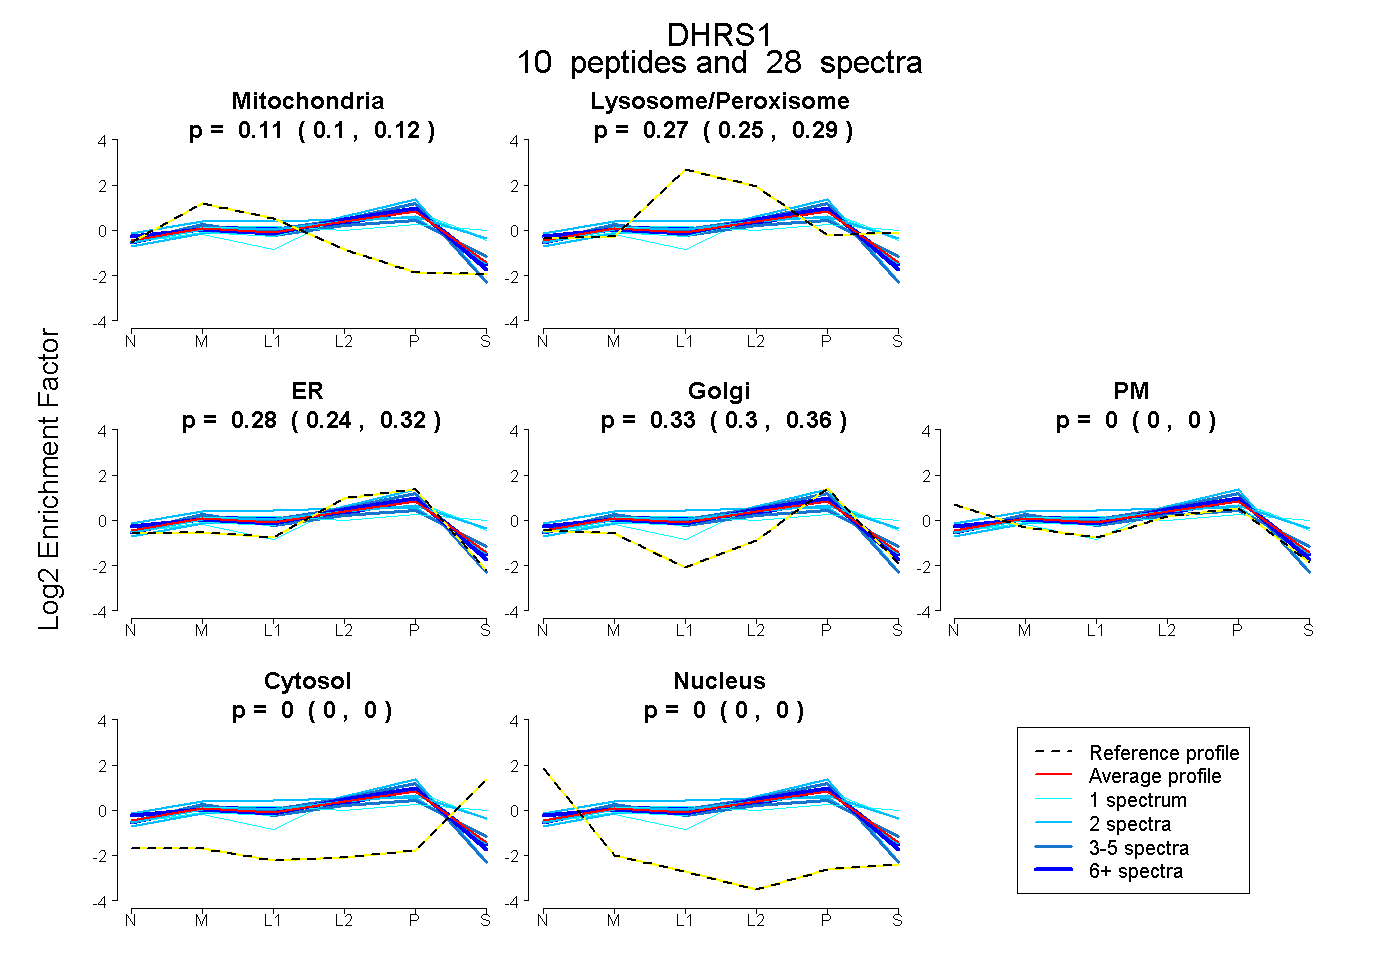 |
0.112 0.097 | 0.125 |
0.271 0.247 | 0.289 |
0.284 0.243 | 0.320 |
0.333 0.298 | 0.360 |
0.000 0.000 | 0.000 |
0.000 0.000 | 0.000 |
0.000 0.000 | 0.000 |
|||
| Plot | Lyso | Other | |||||||||||
| Expt C |
13 peptides |
122 spectra |
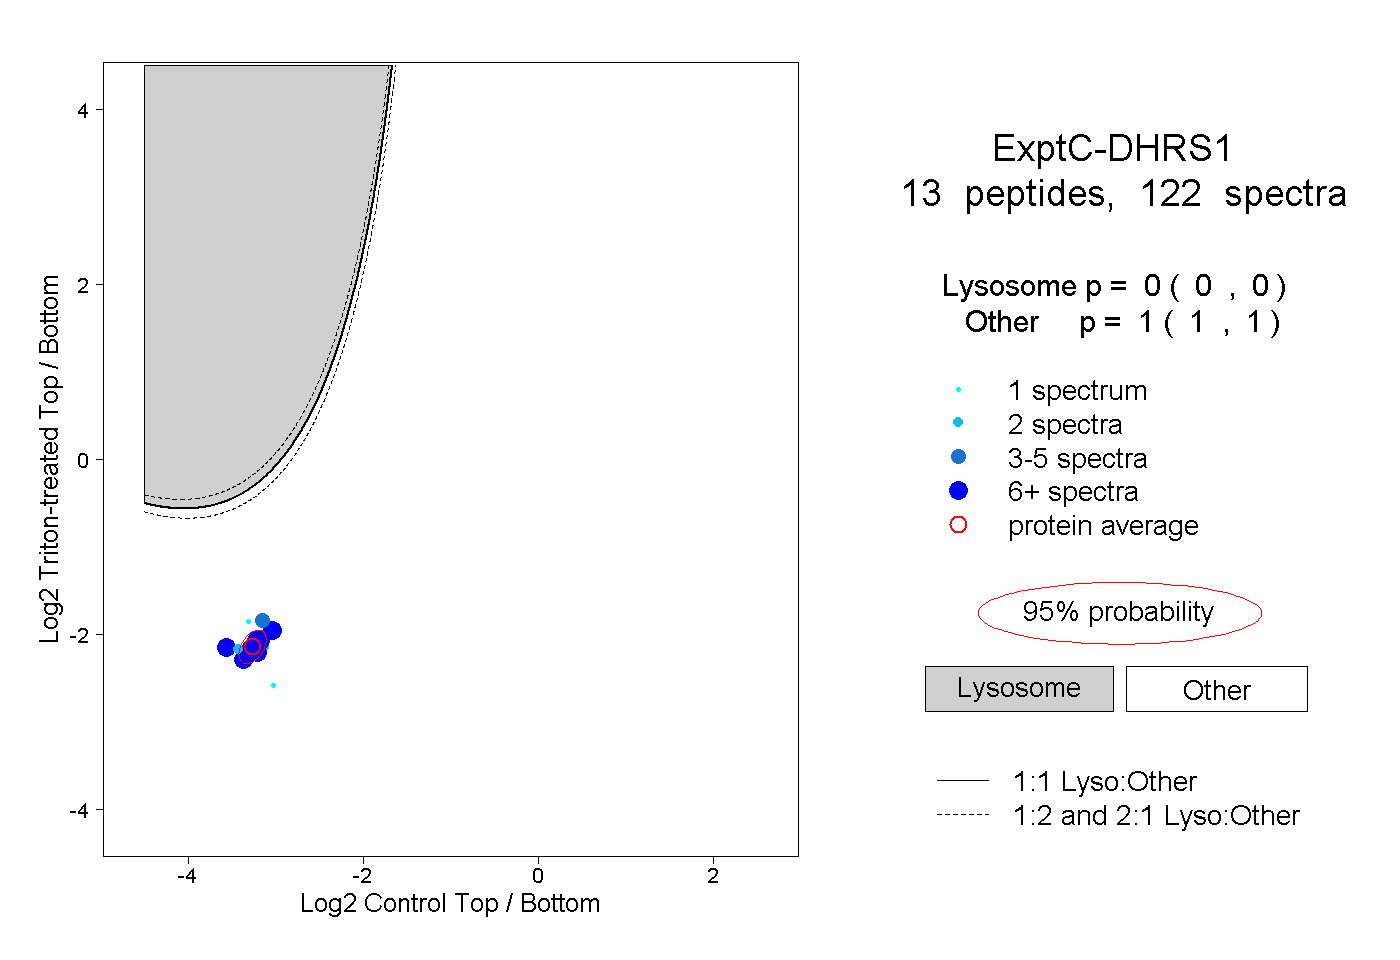 |
0.000 0.000 | 0.000 |
1.000 1.000 | 1.000 |
||||||||
| Plot | Lyso | Other | |||||||||||
| Expt D |
5 peptides |
13 spectra |
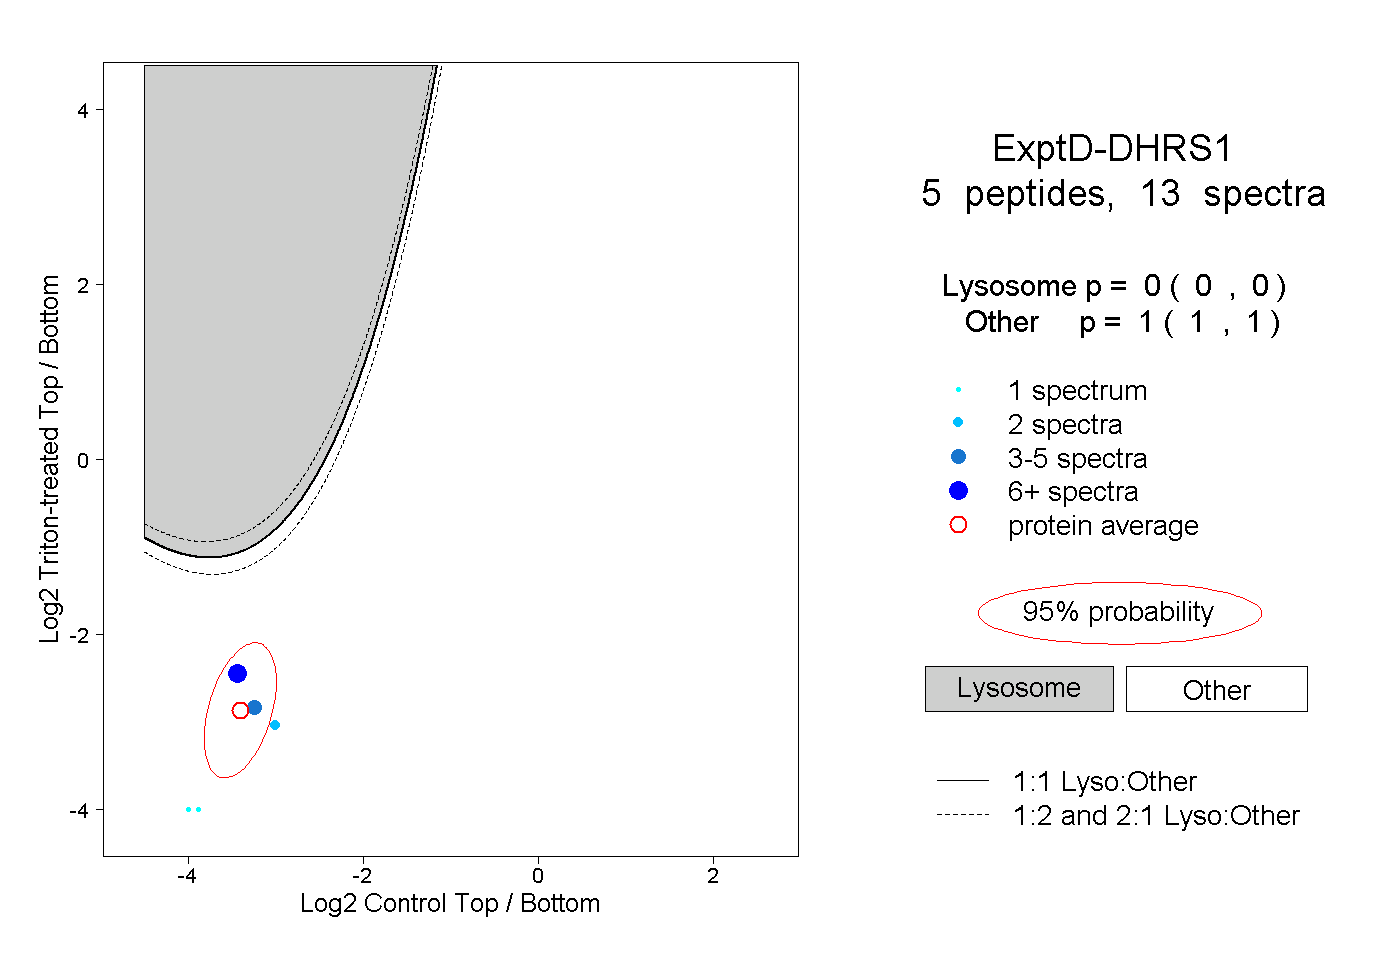 |
0.000 0.000 | 0.000 |
1.000 1.000 | 1.000 |