 13
13peptides
spectra
0.000 | 0.000
0.000 | 0.000
0.016 | 0.056
0.000 | 0.046
0.000 | 0.059
0.000 | 0.036
0.859 | 0.885
0.017 | 0.030
| Plot | Mito | Lyso | Perox | ER | Golgi | PM | Cytosol | Nucleus | |||||
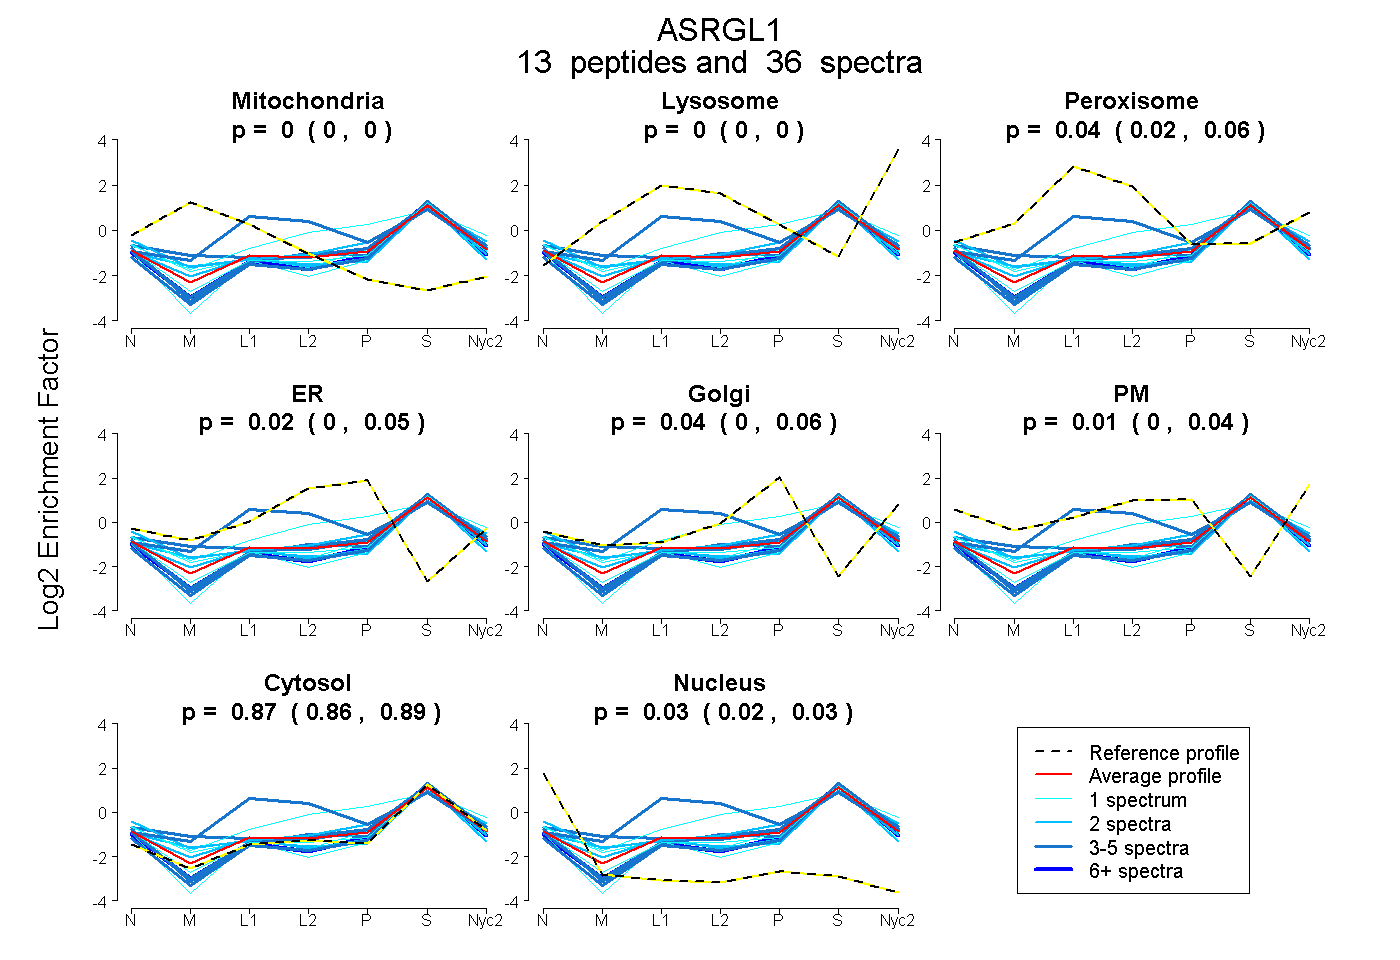
| Expt A |
13 peptides |
36 spectra |
|
0.000 0.000 | 0.000 |
0.000 0.000 | 0.000 |
0.042 0.016 | 0.056 |
0.015 0.000 | 0.046 |
0.038 0.000 | 0.059 |
0.009 0.000 | 0.036 |
0.870 0.859 | 0.885 |
0.025 0.017 | 0.030 |
| 3 spectra, AATEGYNILK | 0.122 | 0.000 | 0.000 | 0.000 | 0.000 | 0.124 | 0.754 | 0.000 | ||
| 5 spectra, TPHCFLTGR | 0.000 | 0.000 | 0.419 | 0.030 | 0.000 | 0.000 | 0.551 | 0.000 | ||
| 1 spectrum, ELVSEGIAK | 0.059 | 0.000 | 0.000 | 0.000 | 0.068 | 0.012 | 0.827 | 0.033 | ||
| 5 spectra, DSVPATPR | 0.000 | 0.000 | 0.000 | 0.035 | 0.000 | 0.000 | 0.934 | 0.031 | ||
| 1 spectrum, WTSASMPWAAVK | 0.000 | 0.000 | 0.000 | 0.000 | 0.000 | 0.030 | 0.932 | 0.039 | ||
| 3 spectra, TVDEAATLALDYMK | 0.000 | 0.000 | 0.000 | 0.000 | 0.000 | 0.000 | 0.969 | 0.031 | ||
| 2 spectra, GLGGLILINK | 0.082 | 0.000 | 0.000 | 0.000 | 0.000 | 0.000 | 0.901 | 0.017 | ||
| 1 spectrum, GNLAYATSTGGIVNK | 0.000 | 0.000 | 0.000 | 0.000 | 0.000 | 0.000 | 0.909 | 0.091 | ||
| 6 spectra, DLSAGAVSAVR | 0.000 | 0.000 | 0.000 | 0.000 | 0.000 | 0.000 | 0.939 | 0.061 | ||
| 2 spectra, CIANPVK | 0.144 | 0.000 | 0.000 | 0.000 | 0.000 | 0.000 | 0.849 | 0.006 | ||
| 1 spectrum, FAADMGIPQTPAEK | 0.000 | 0.013 | 0.103 | 0.129 | 0.137 | 0.000 | 0.618 | 0.000 | ||
| 2 spectra, NSGTVGAVALDCK | 0.000 | 0.000 | 0.000 | 0.000 | 0.014 | 0.194 | 0.777 | 0.014 | ||
| 4 spectra, LALFHVEQGK | 0.000 | 0.000 | 0.000 | 0.019 | 0.054 | 0.000 | 0.923 | 0.005 |
| Plot | Mito | Lyso or Perox | ER | Golgi | PM | Cytosol | Nucleus | ||||||
| Expt B |
4 peptides |
9 spectra |
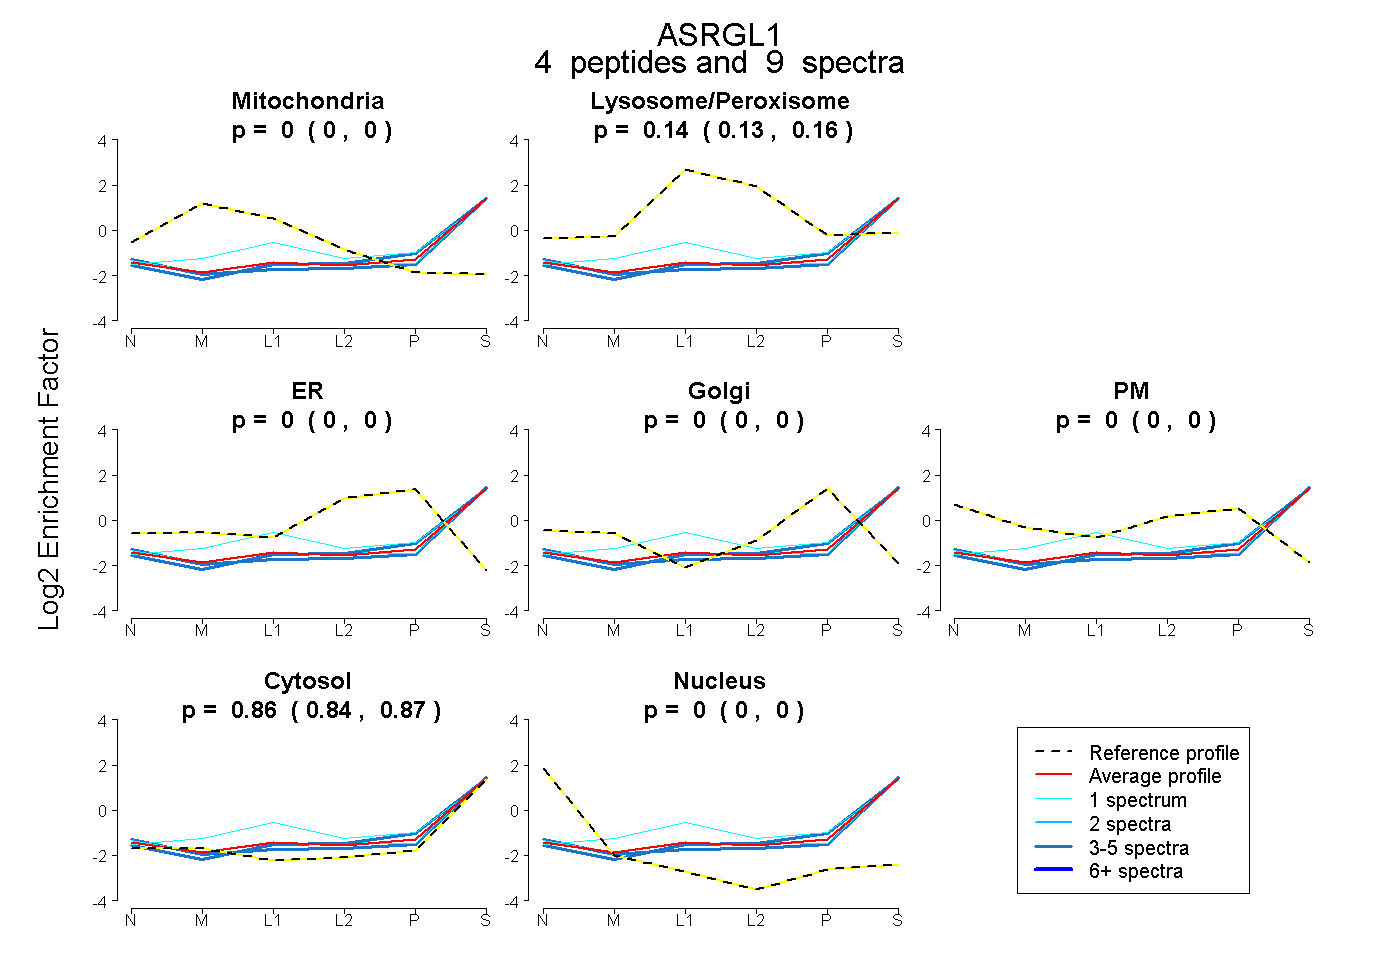 |
0.000 0.000 | 0.000 |
0.143 0.127 | 0.158 |
0.000 0.000 | 0.000 |
0.000 0.000 | 0.000 |
0.000 0.000 | 0.000 |
0.857 0.838 | 0.870 |
0.000 0.000 | 0.000 |
|||
| Plot | Lyso | Other | |||||||||||
| Expt C |
12 peptides |
37 spectra |
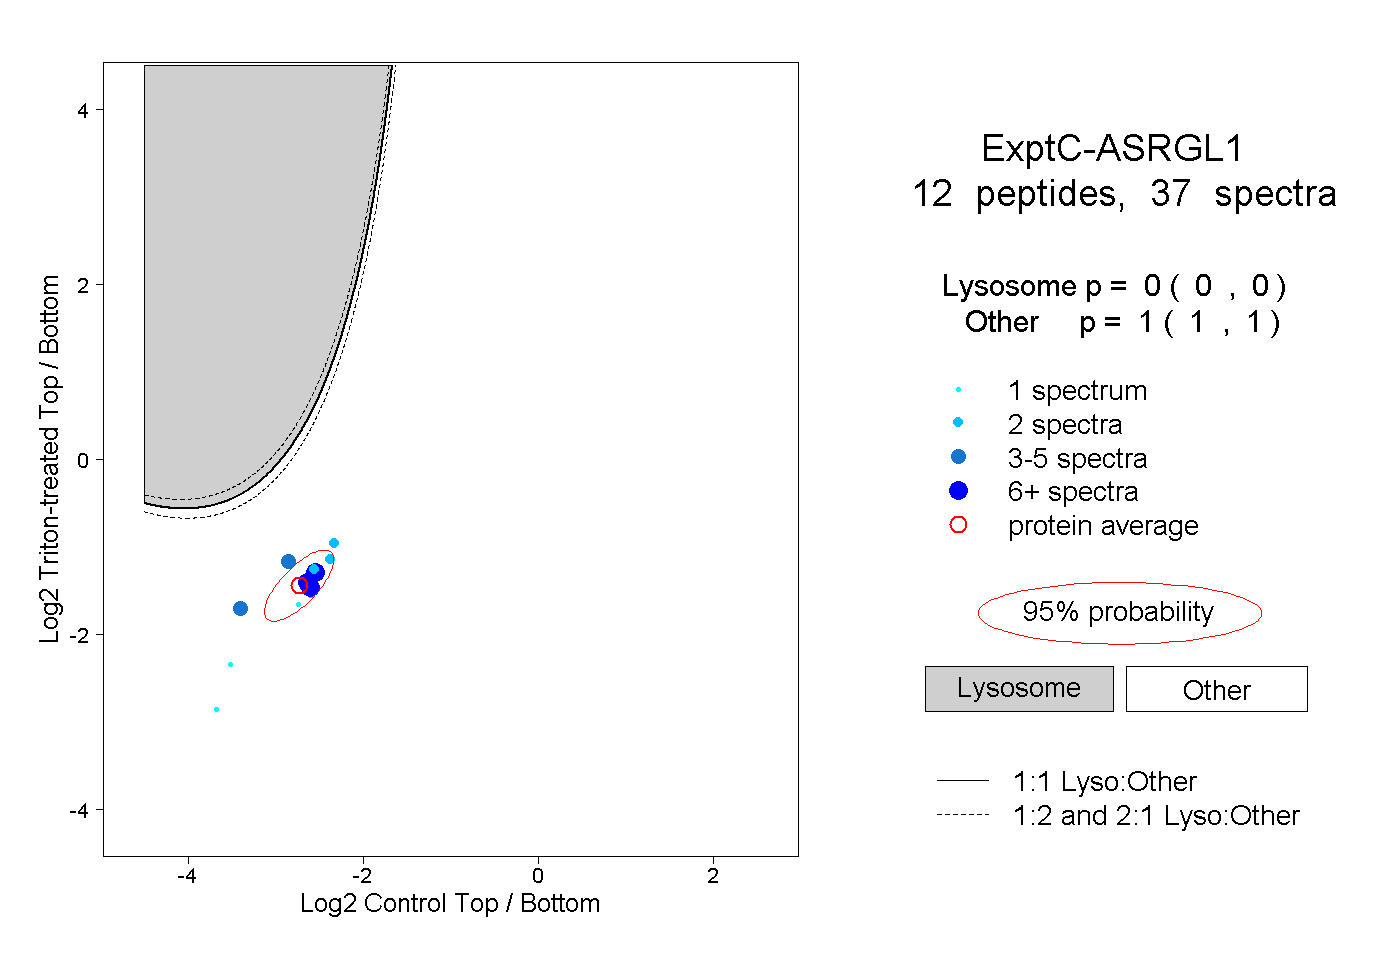 |
0.000 0.000 | 0.000 |
1.000 1.000 | 1.000 |
||||||||
| Plot | Lyso | Other | |||||||||||
| Expt D |
3 peptides |
6 spectra |
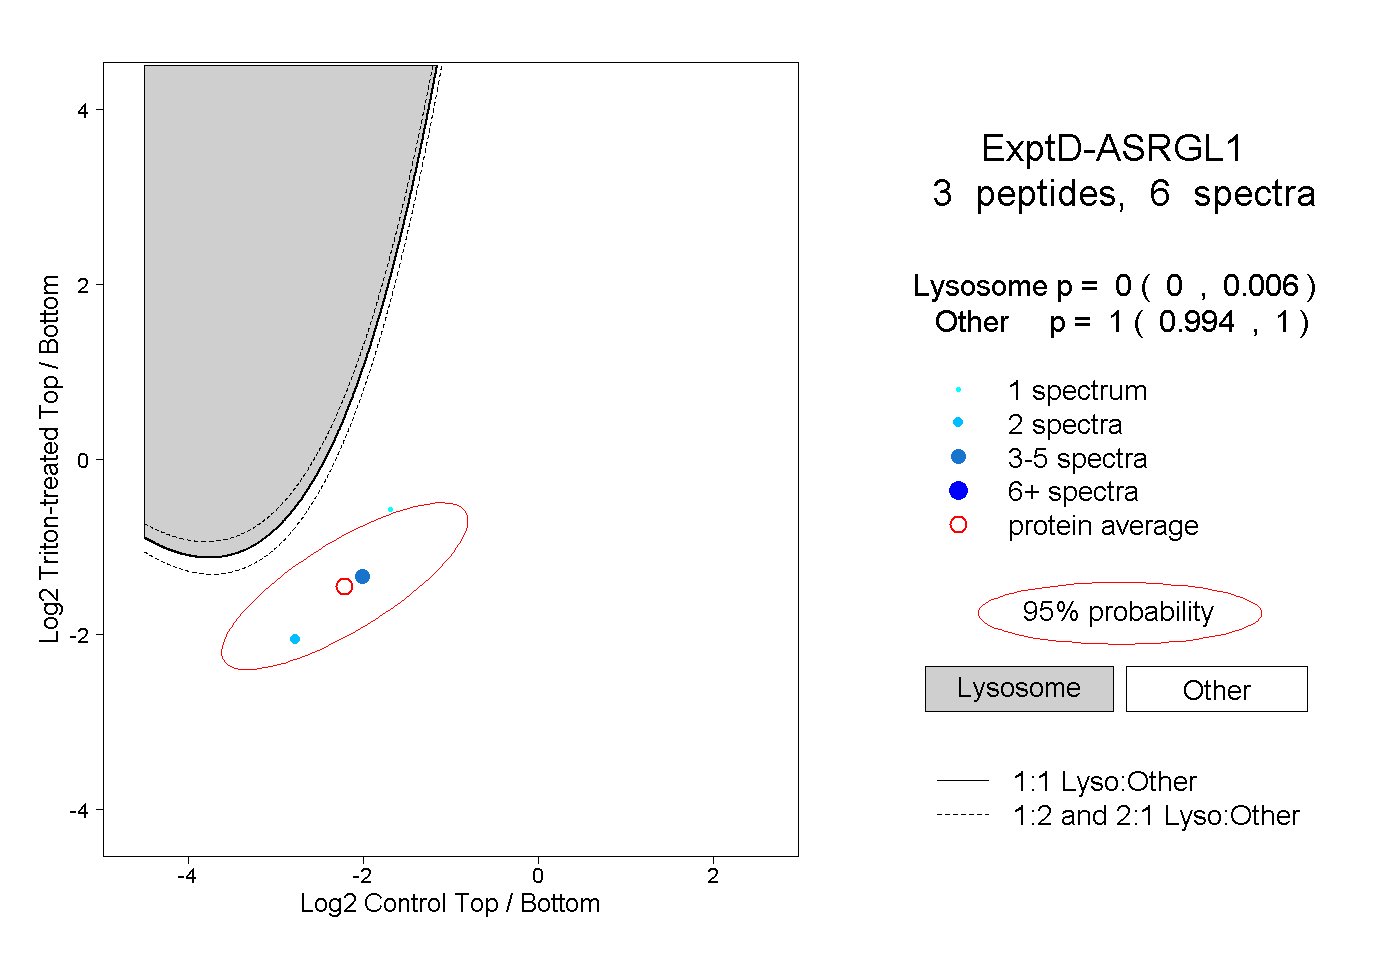 |
0.000 0.000 | 0.006 |
1.000 0.994 | 1.000 |