 13
13peptides
spectra
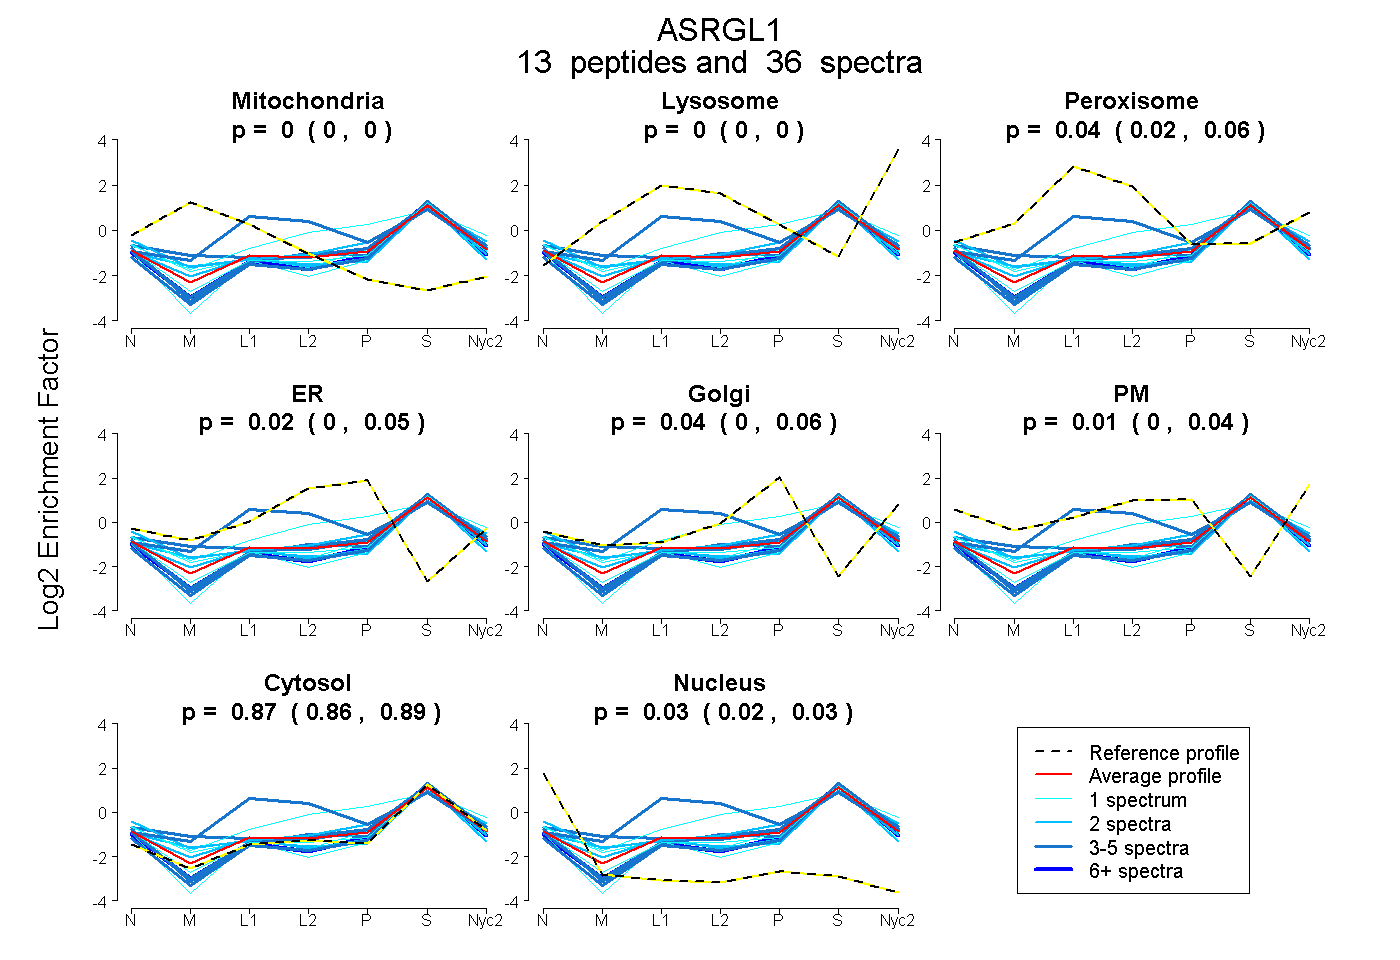
0.000 | 0.000
0.000 | 0.000
0.016 | 0.056
0.000 | 0.046
0.000 | 0.059
0.000 | 0.036
0.859 | 0.885
0.017 | 0.030
4peptides
spectra
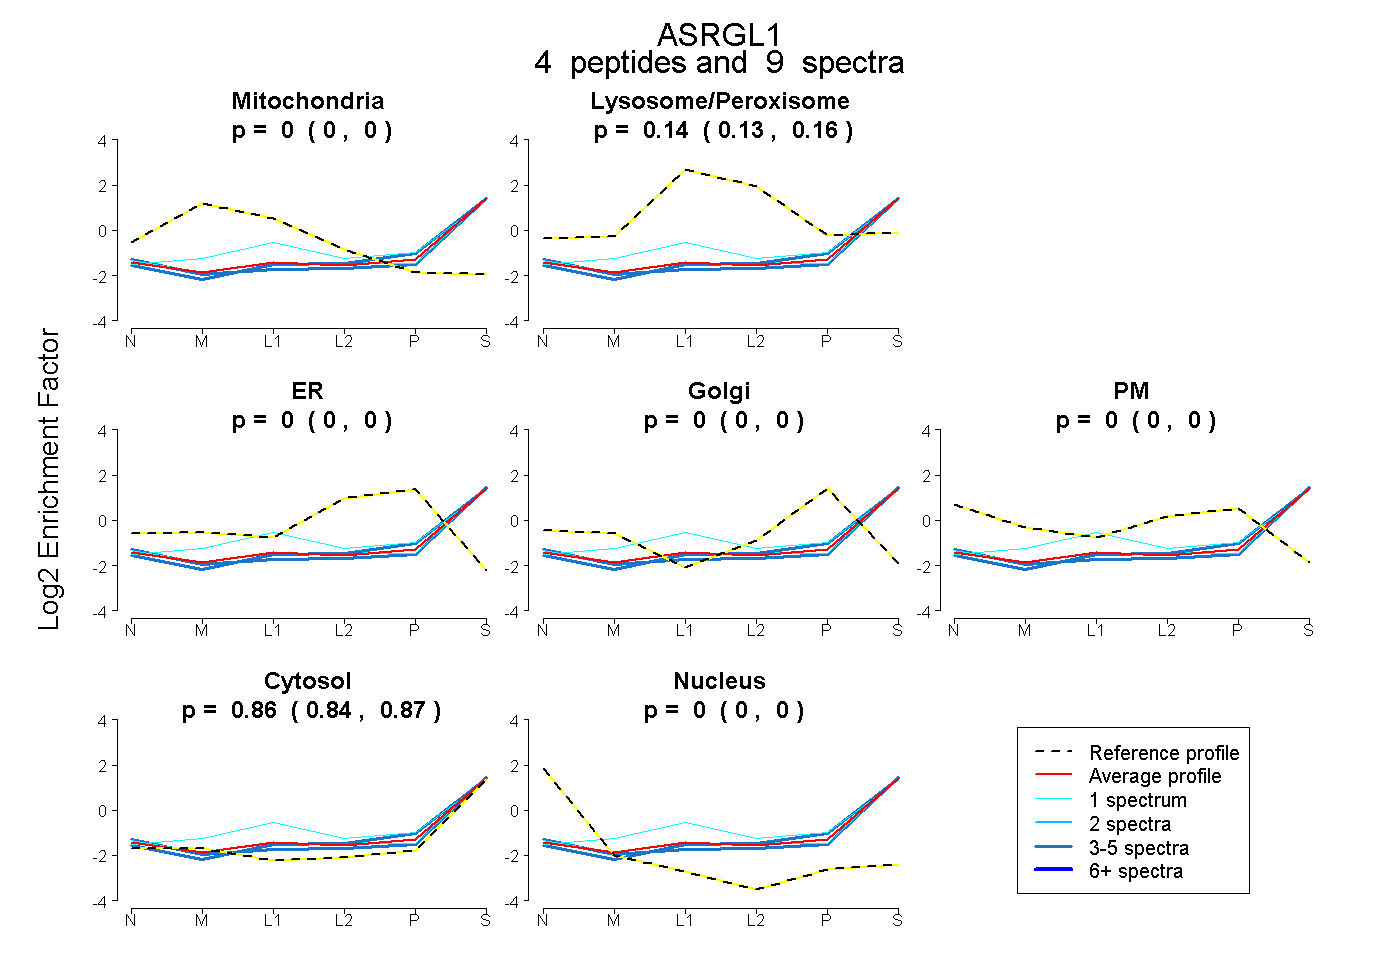
0.000 | 0.000
0.127 | 0.158
0.000 | 0.000
0.000 | 0.000
0.000 | 0.000
0.838 | 0.870
0.000 | 0.000
12peptides
spectra
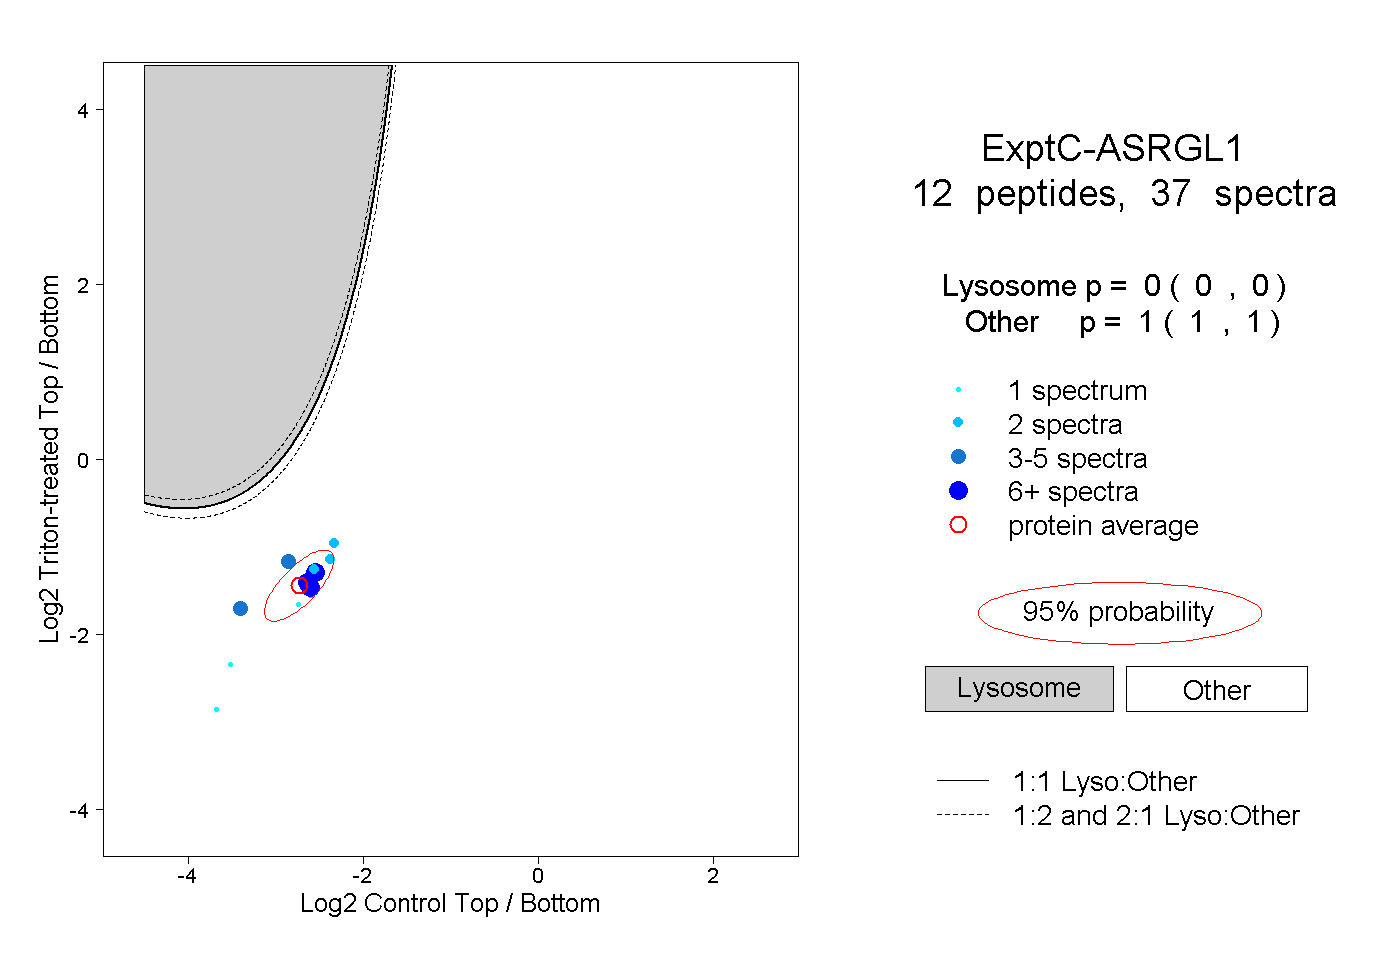
0.000 | 0.000
1.000 | 1.000
3peptides
spectra
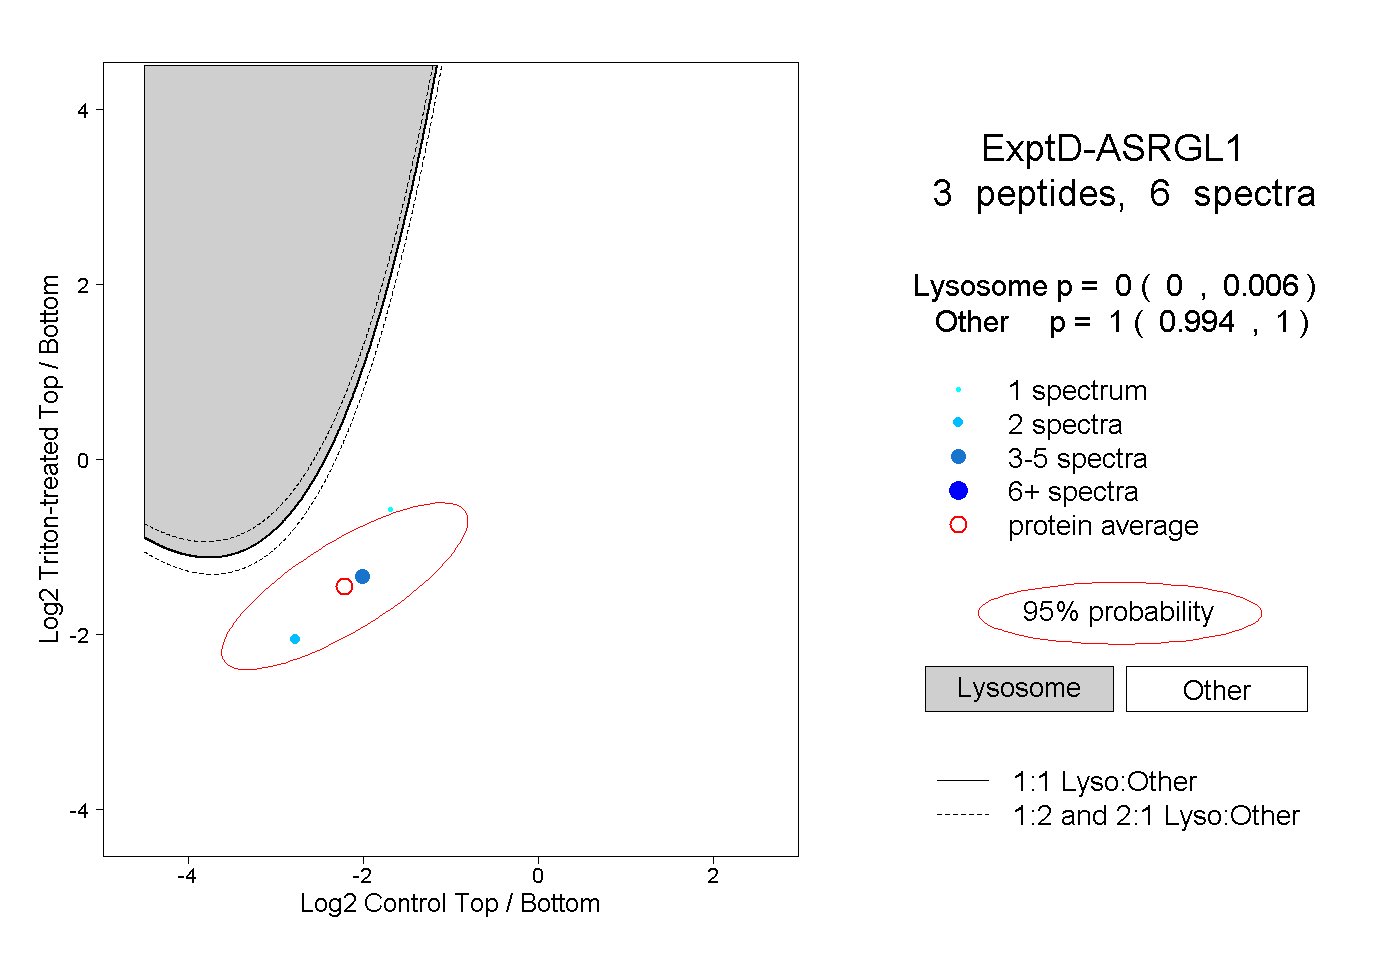
0.000 | 0.006
0.994 | 1.000