 3
3peptides
spectra
0.000 | 0.178
0.000 | 0.100
0.037 | 0.176
0.000 | 0.000
0.000 | 0.000
0.000 | 0.066
0.629 | 0.836
0.000 | 0.037
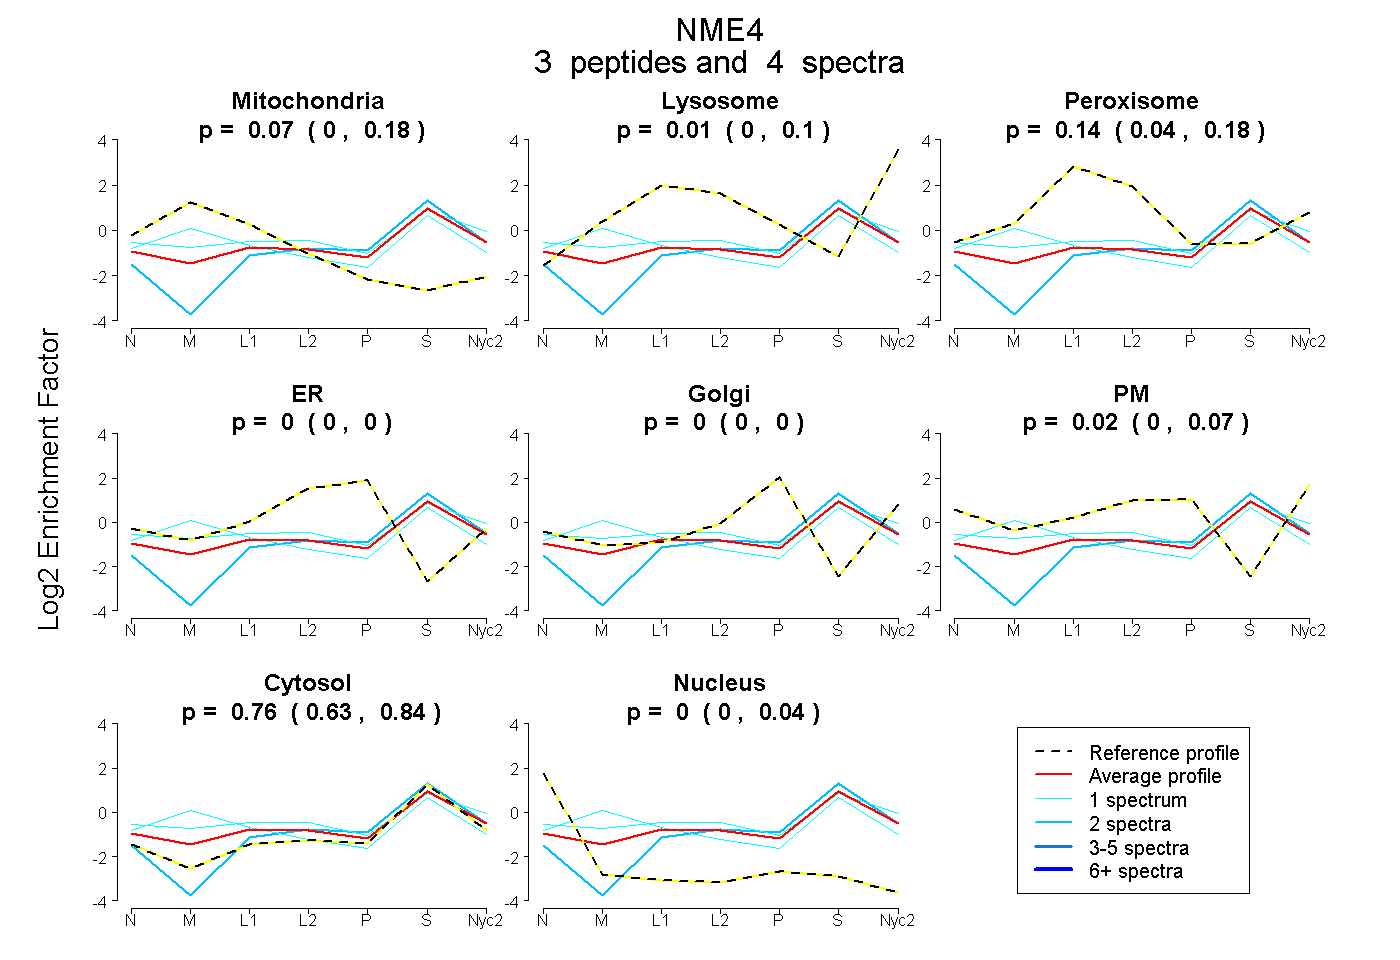
| Plot | Mito | Lyso | Perox | ER | Golgi | PM | Cytosol | Nucleus | |||||
| Expt A |
3 peptides |
4 spectra |
|
0.066 0.000 | 0.178 |
0.007 0.000 | 0.100 |
0.143 0.037 | 0.176 |
0.000 0.000 | 0.000 |
0.000 0.000 | 0.000 |
0.021 0.000 | 0.066 |
0.762 0.629 | 0.836 |
0.000 0.000 | 0.037 |
| 1 spectrum, LQQLDEENSELR | 0.080 | 0.052 | 0.194 | 0.000 | 0.000 | 0.059 | 0.615 | 0.000 | ||
| 1 spectrum, MLDEIEELTQR | 0.353 | 0.003 | 0.074 | 0.000 | 0.000 | 0.000 | 0.570 | 0.000 | ||
| 2 spectra, ESELEQEVR | 0.000 | 0.000 | 0.000 | 0.029 | 0.000 | 0.000 | 0.971 | 0.000 |