 5
5peptides
spectra
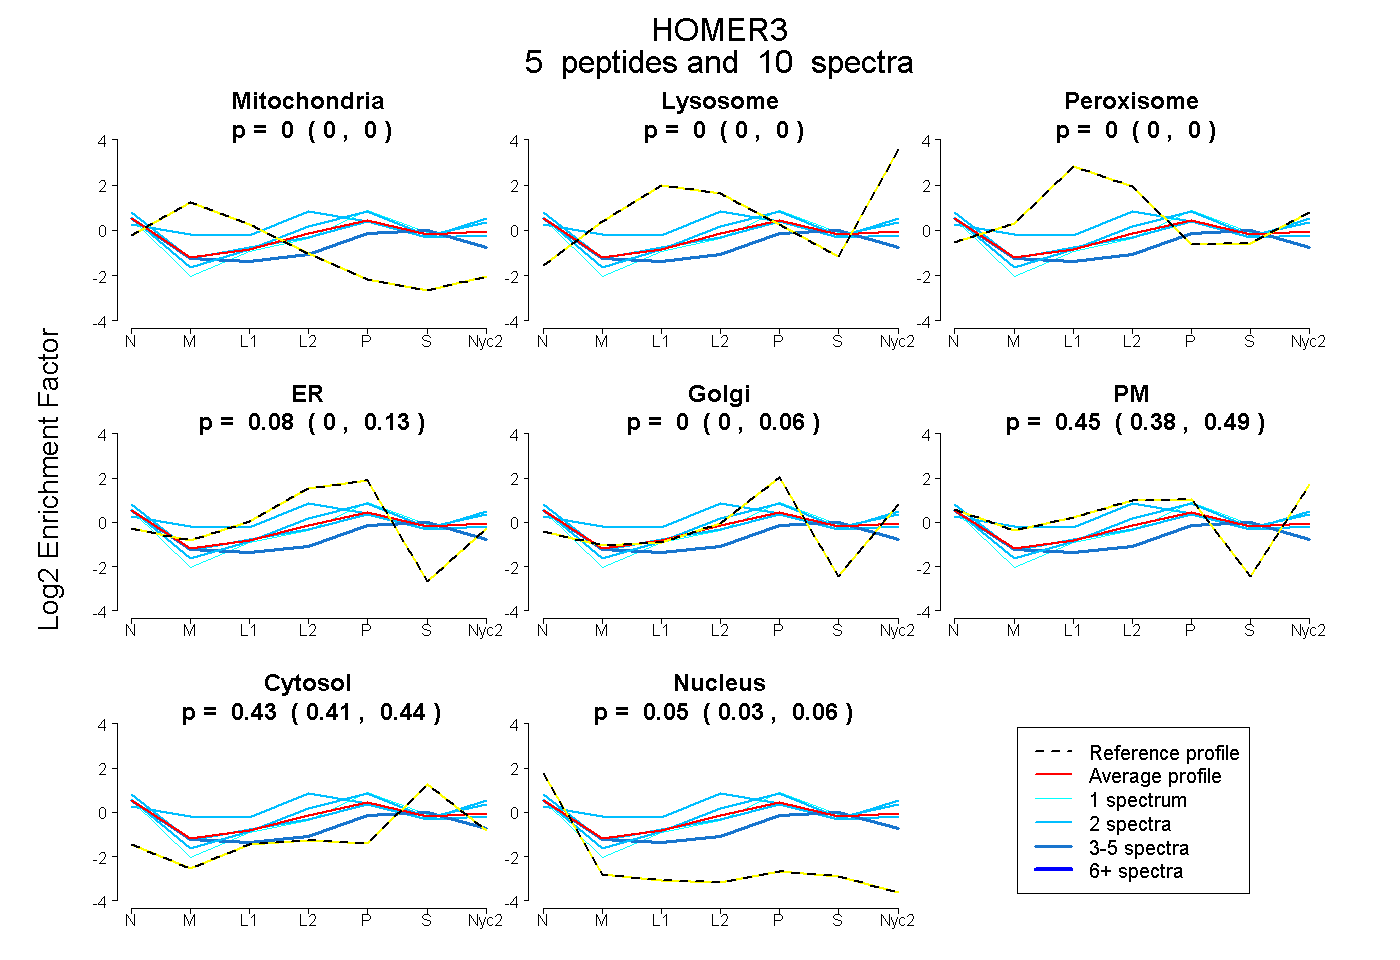
0.000 | 0.000
0.000 | 0.000
0.000 | 0.000
0.004 | 0.127
0.000 | 0.058
0.383 | 0.485
0.410 | 0.441
0.029 | 0.061
| Plot | Mito | Lyso | Perox | ER | Golgi | PM | Cytosol | Nucleus | |||||
| Expt A |
5 peptides |
10 spectra |
|
0.000 0.000 | 0.000 |
0.000 0.000 | 0.000 |
0.000 0.000 | 0.000 |
0.076 0.004 | 0.127 |
0.000 0.000 | 0.058 |
0.447 0.383 | 0.485 |
0.429 0.410 | 0.441 |
0.047 0.029 | 0.061 |
| 2 spectra, AEAEHLR | 0.000 | 0.000 | 0.193 | 0.051 | 0.000 | 0.475 | 0.282 | 0.000 | ||
| 2 spectra, VAELEAQVAAEPVR | 0.000 | 0.000 | 0.000 | 0.048 | 0.122 | 0.421 | 0.409 | 0.000 | ||
| 3 spectra, LAGALR | 0.000 | 0.000 | 0.000 | 0.000 | 0.064 | 0.291 | 0.475 | 0.171 | ||
| 2 spectra, FGQWADSR | 0.000 | 0.000 | 0.000 | 0.057 | 0.000 | 0.463 | 0.382 | 0.099 | ||
| 1 spectrum, EATSQSVEQLEAR | 0.000 | 0.000 | 0.000 | 0.049 | 0.273 | 0.206 | 0.440 | 0.031 |
| Plot | Lyso | Other | |||||||||||
| Expt C |
7 peptides |
14 spectra |
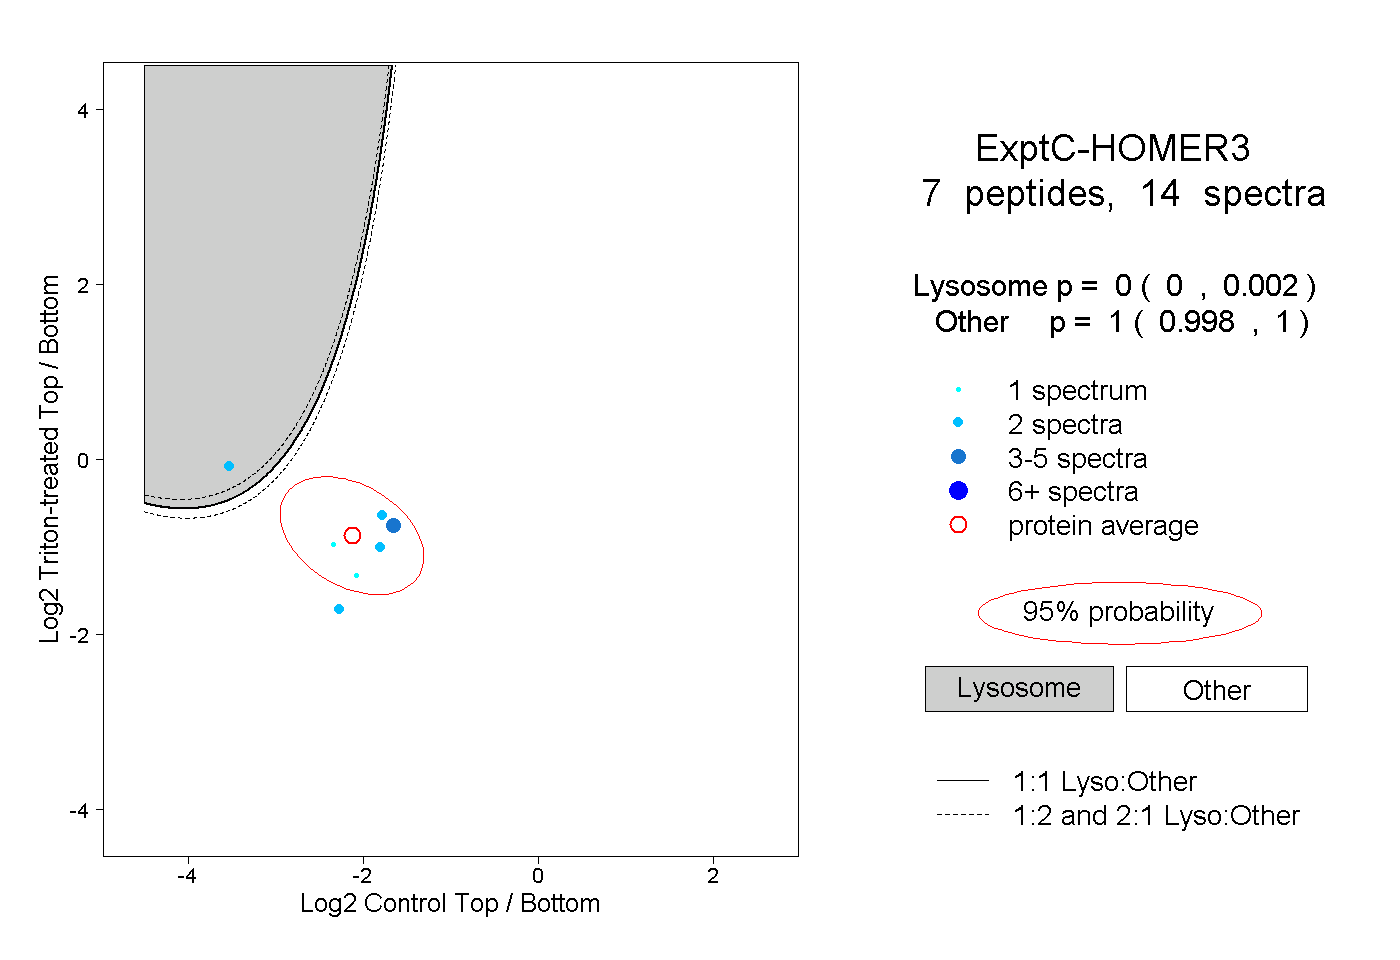 |
0.000 0.000 | 0.002 |
1.000 0.998 | 1.000 |