 16
16peptides
spectra
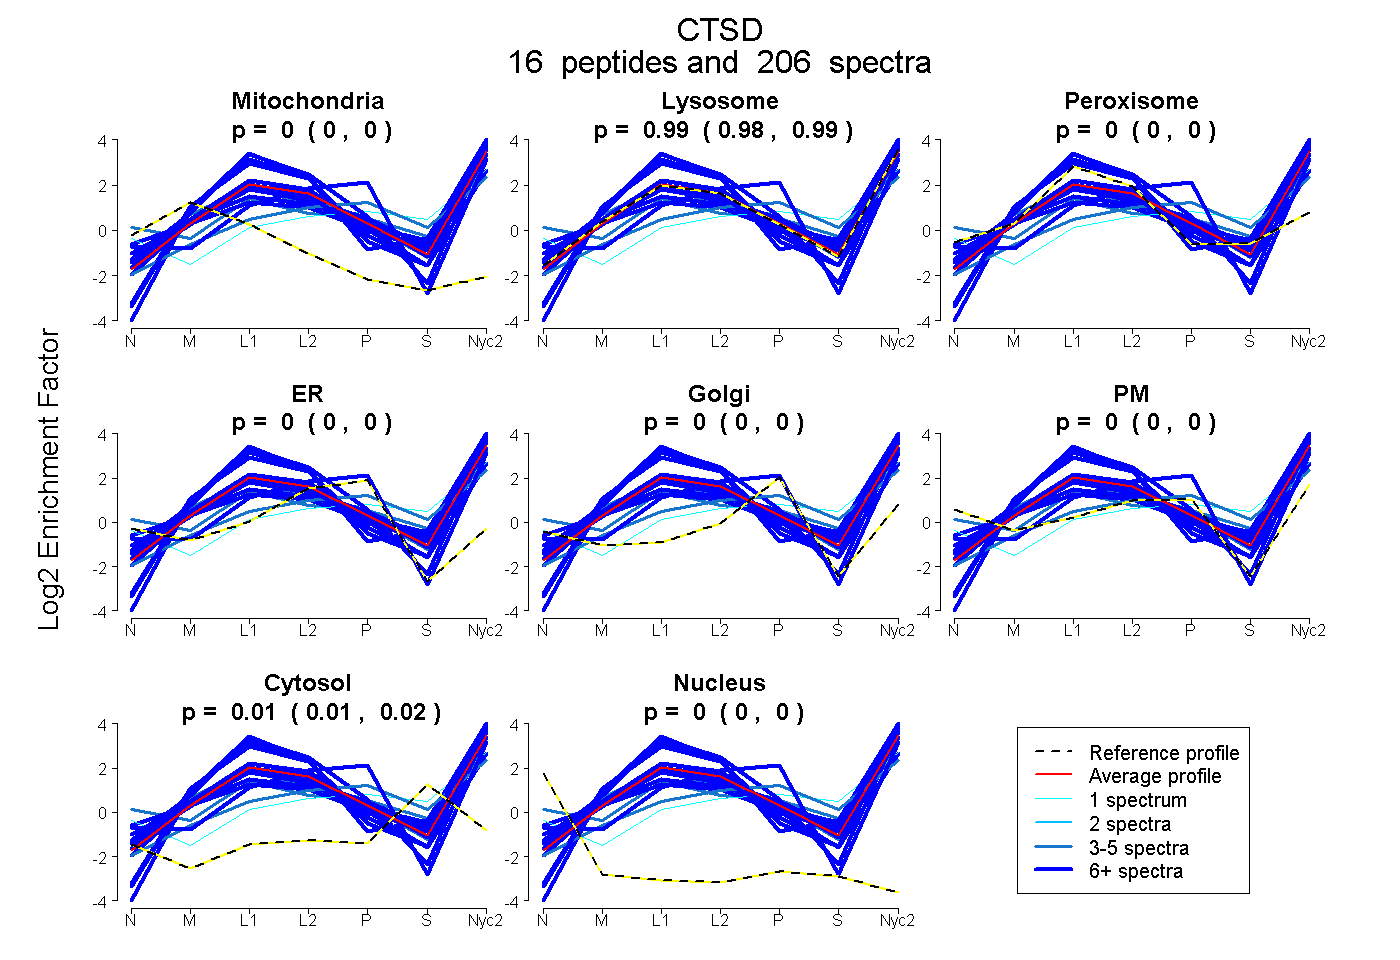
0.000 | 0.000
0.983 | 0.989
0.000 | 0.004
0.000 | 0.000
0.000 | 0.000
0.000 | 0.000
0.010 | 0.016
0.000 | 0.000
15peptides
spectra
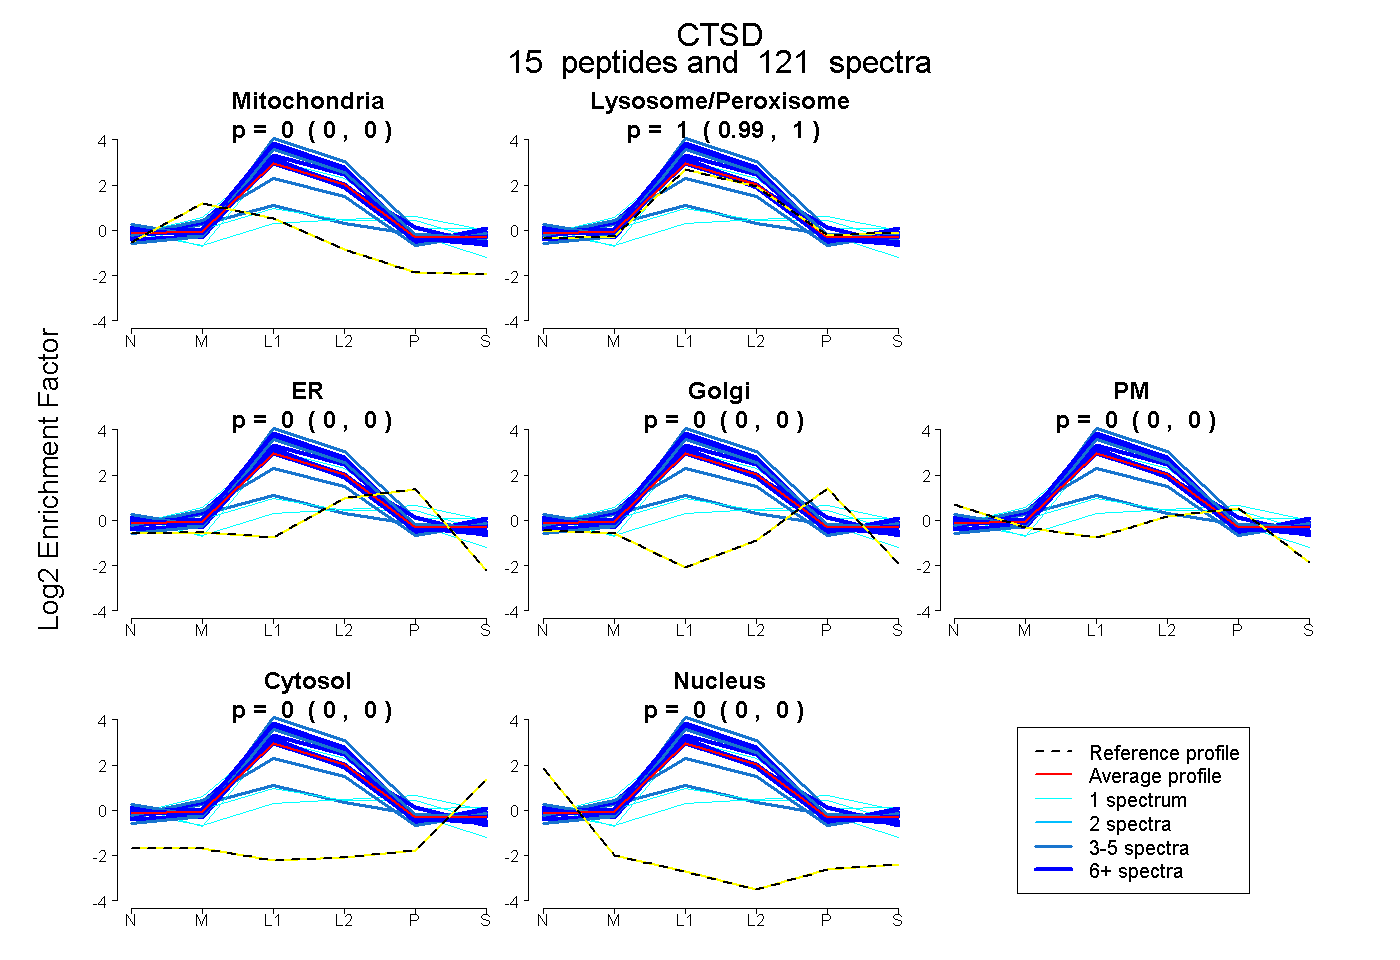
0.000 | 0.004
0.995 | 1.000
0.000 | 0.000
0.000 | 0.000
0.000 | 0.000
0.000 | 0.000
0.000 | 0.000
14peptides
spectra
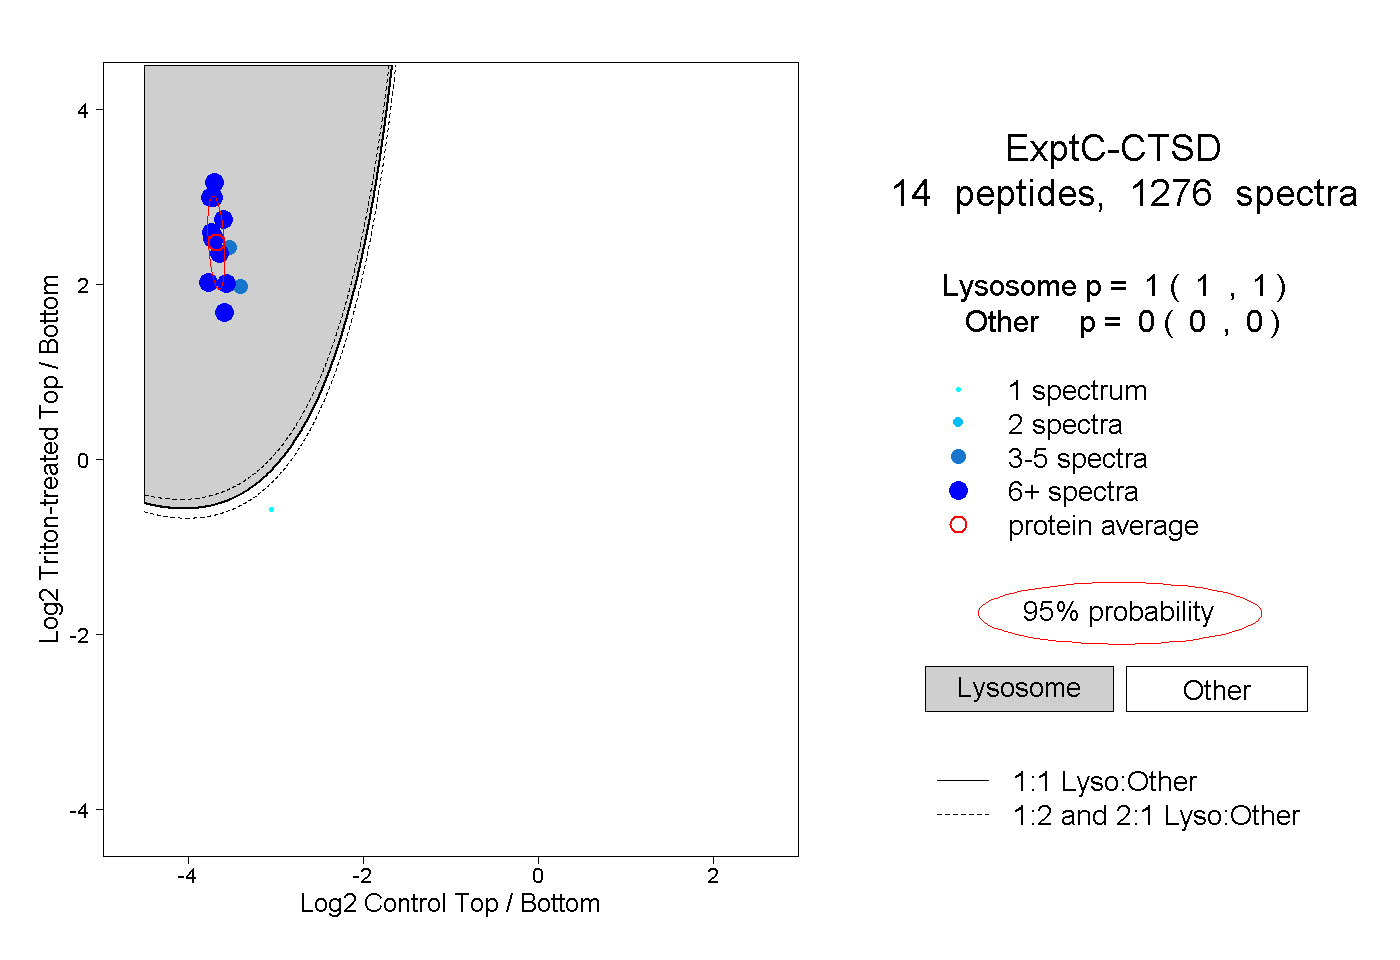
1.000 | 1.000
0.000 | 0.000
9peptides
spectra
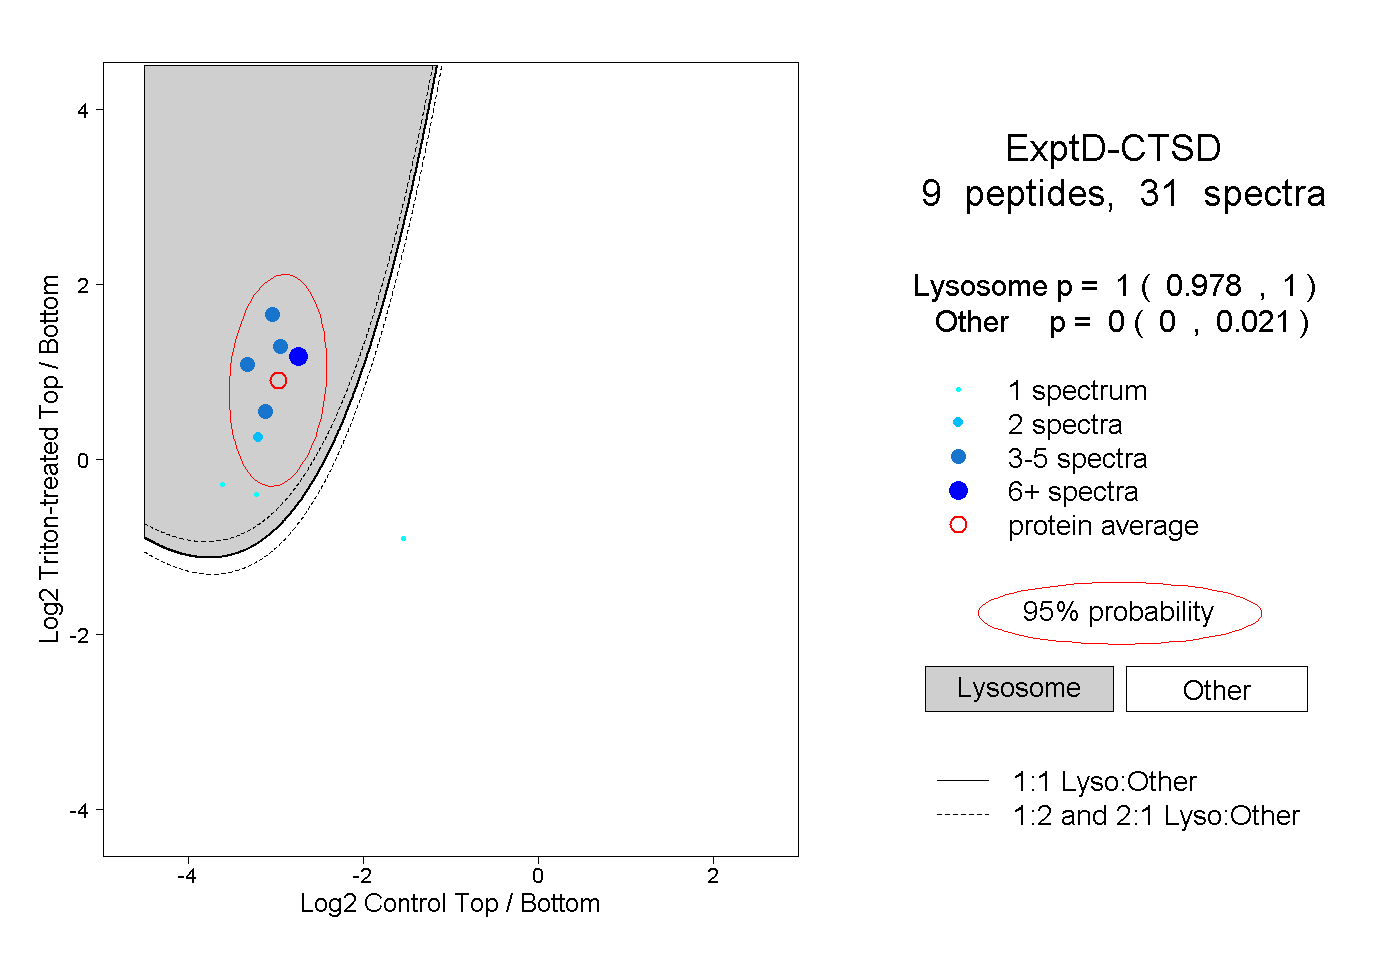
0.978 | 1.000
0.000 | 0.021