 3
3peptides
spectra
0.000 | 0.061
0.000 | 0.000
0.000 | 0.025
0.253 | 0.437
0.000 | 0.050
0.000 | 0.000
0.218 | 0.331
0.264 | 0.397
1peptide
spectrum
NA | NA
NA | NA
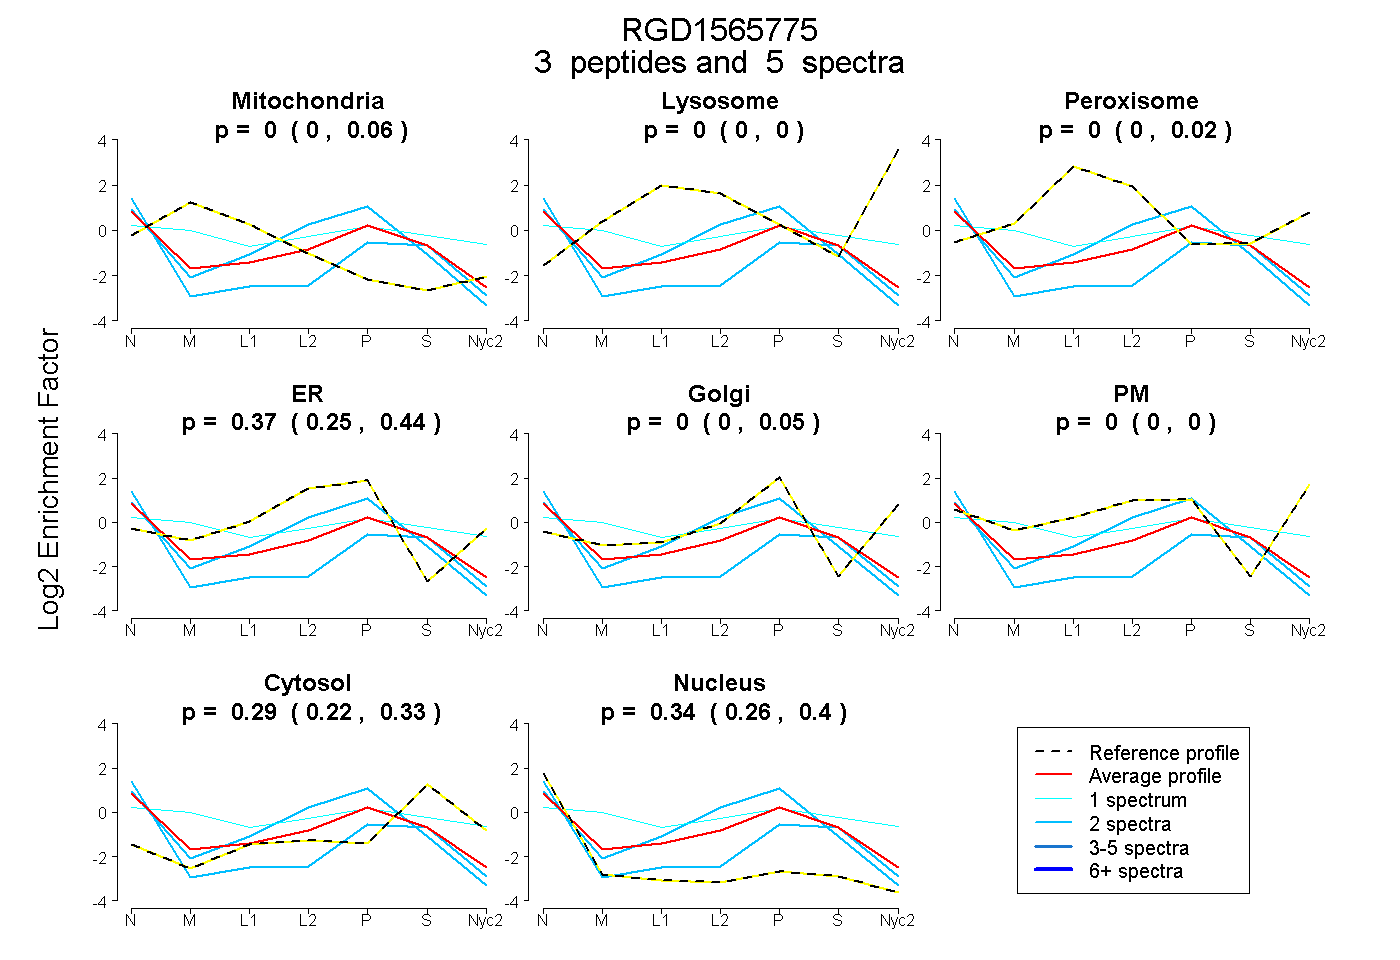
| Plot | Mito | Lyso | Perox | ER | Golgi | PM | Cytosol | Nucleus | |||||
| Expt A |
3 peptides |
5 spectra |
|
0.000 0.000 | 0.061 |
0.000 0.000 | 0.000 |
0.000 0.000 | 0.025 |
0.374 0.253 | 0.437 |
0.000 0.000 | 0.050 |
0.000 0.000 | 0.000 |
0.285 0.218 | 0.331 |
0.341 0.264 | 0.397 |
||
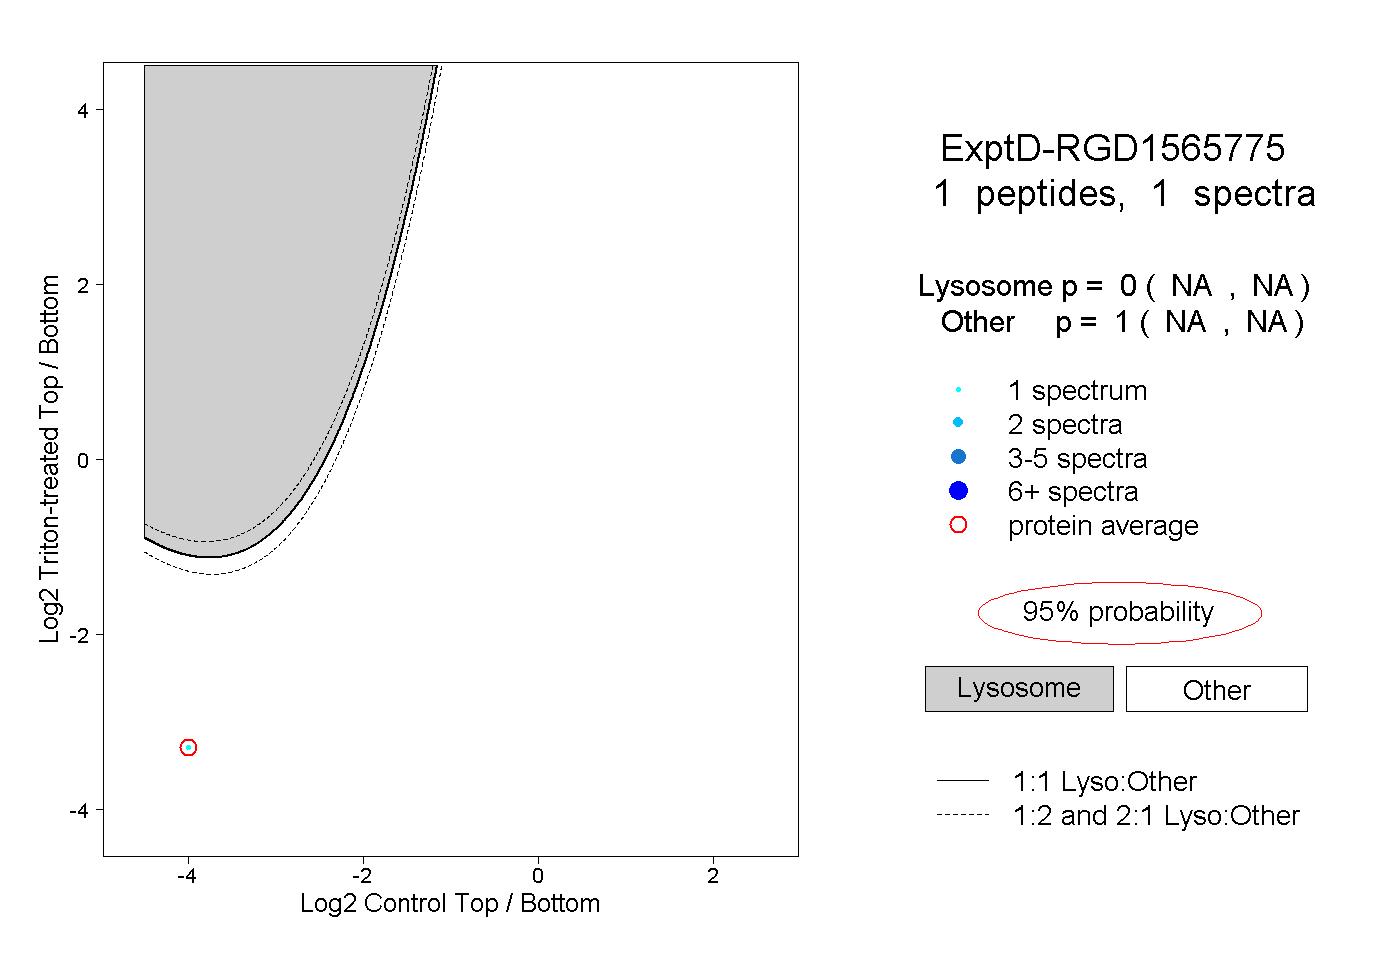
| Plot | Lyso | Other | |||||||||||
| Expt D |
1 peptide |
1 spectrum |
|
0.000 NA | NA |
1.000 NA | NA |