 5
5peptides
spectra
0.000 | 0.000
0.000 | 0.000
0.000 | 0.000
0.000 | 0.000
0.000 | 0.020
0.000 | 0.000
0.884 | 0.912
0.079 | 0.104
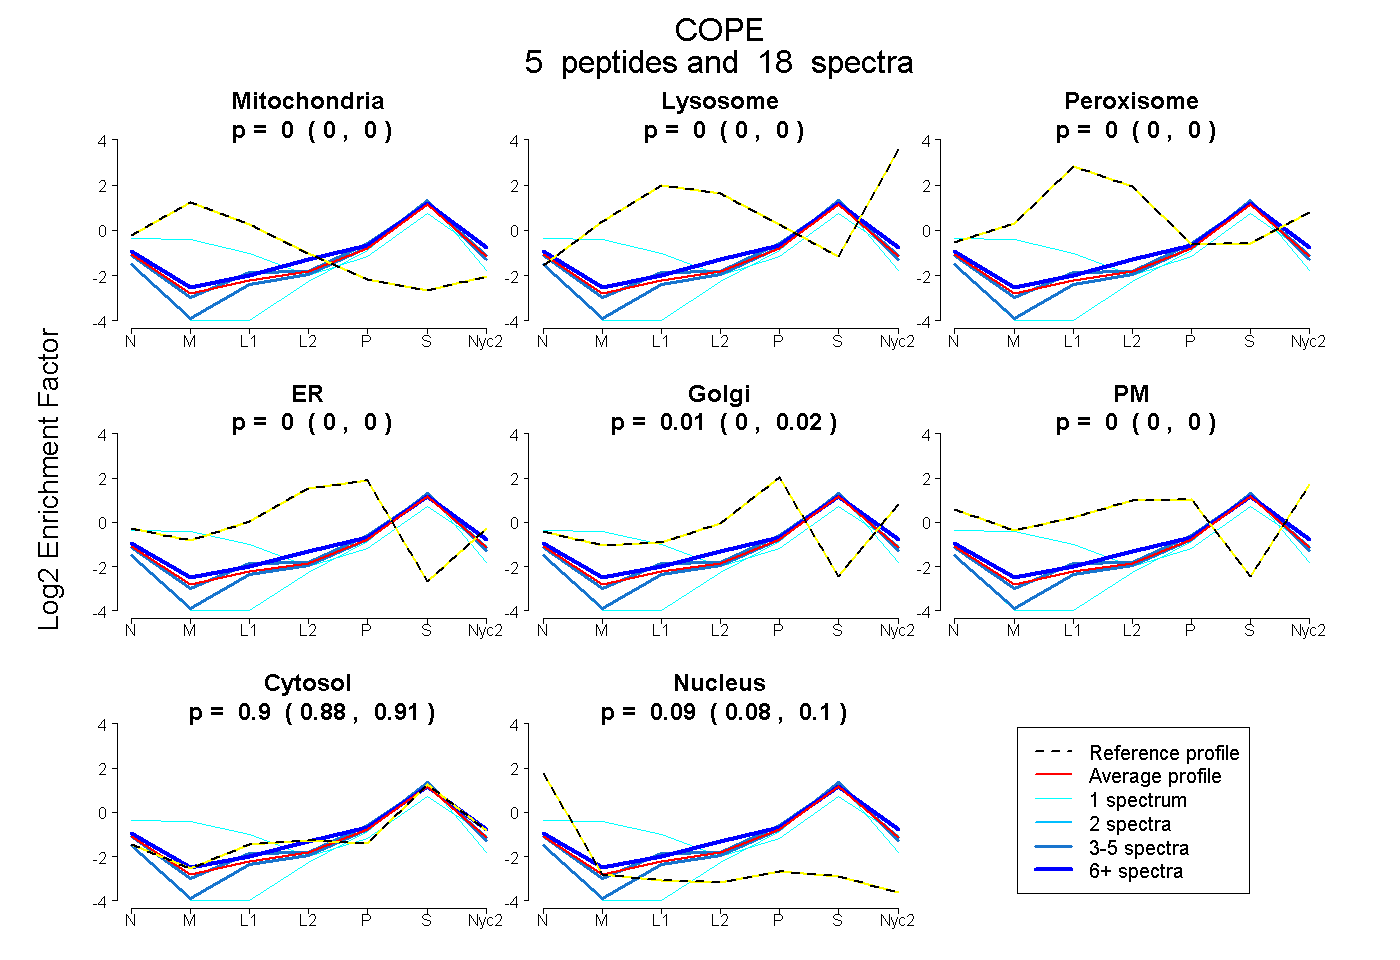
| Plot | Mito | Lyso | Perox | ER | Golgi | PM | Cytosol | Nucleus | |||||
| Expt A |
5 peptides |
18 spectra |
|
0.000 0.000 | 0.000 |
0.000 0.000 | 0.000 |
0.000 0.000 | 0.000 |
0.000 0.000 | 0.000 |
0.006 0.000 | 0.020 |
0.000 0.000 | 0.000 |
0.901 0.884 | 0.912 |
0.093 0.079 | 0.104 |
| 4 spectra, DSIVLELDR | 0.000 | 0.000 | 0.000 | 0.000 | 0.000 | 0.000 | 0.929 | 0.071 | ||
| 8 spectra, LSSEPR | 0.000 | 0.000 | 0.000 | 0.000 | 0.089 | 0.000 | 0.884 | 0.027 | ||
| 4 spectra, DVFLYR | 0.000 | 0.000 | 0.000 | 0.000 | 0.027 | 0.000 | 0.910 | 0.062 | ||
| 1 spectrum, AYLAQR | 0.331 | 0.000 | 0.000 | 0.000 | 0.002 | 0.000 | 0.667 | 0.000 | ||
| 1 spectrum, APPAPGAVSGSSGEVDELFDVK | 0.000 | 0.000 | 0.000 | 0.000 | 0.000 | 0.000 | 0.814 | 0.186 |
| Plot | Mito | Lyso or Perox | ER | Golgi | PM | Cytosol | Nucleus | ||||||
| Expt B |
4 peptides |
8 spectra |
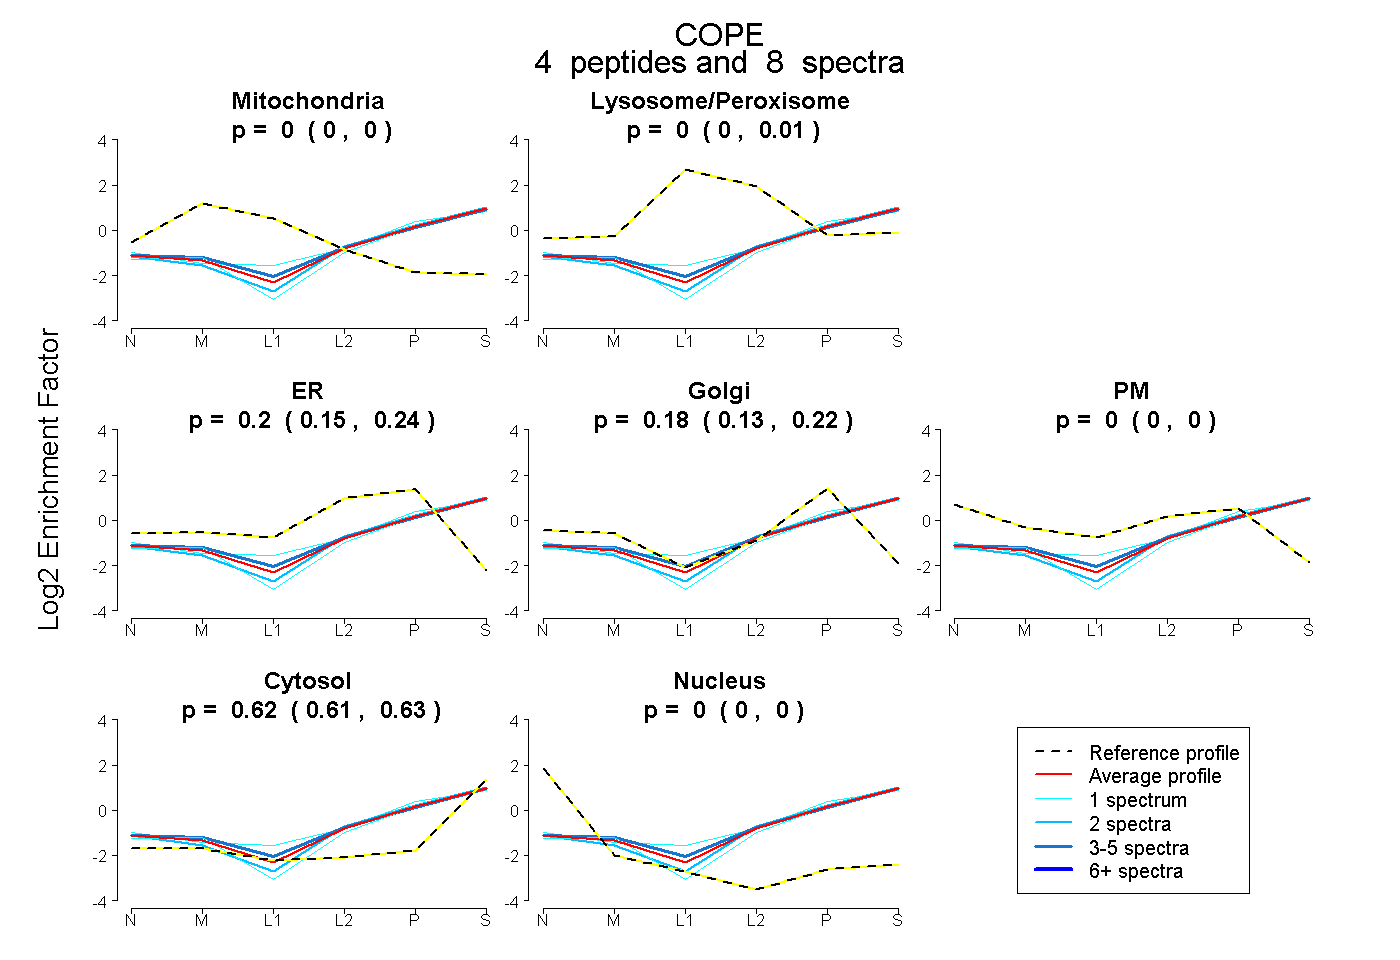 |
0.000 0.000 | 0.000 |
0.000 0.000 | 0.007 |
0.201 0.151 | 0.235 |
0.180 0.133 | 0.225 |
0.000 0.000 | 0.000 |
0.619 0.609 | 0.626 |
0.000 0.000 | 0.000 |
|||
| Plot | Lyso | Other | |||||||||||
| Expt C |
6 peptides |
13 spectra |
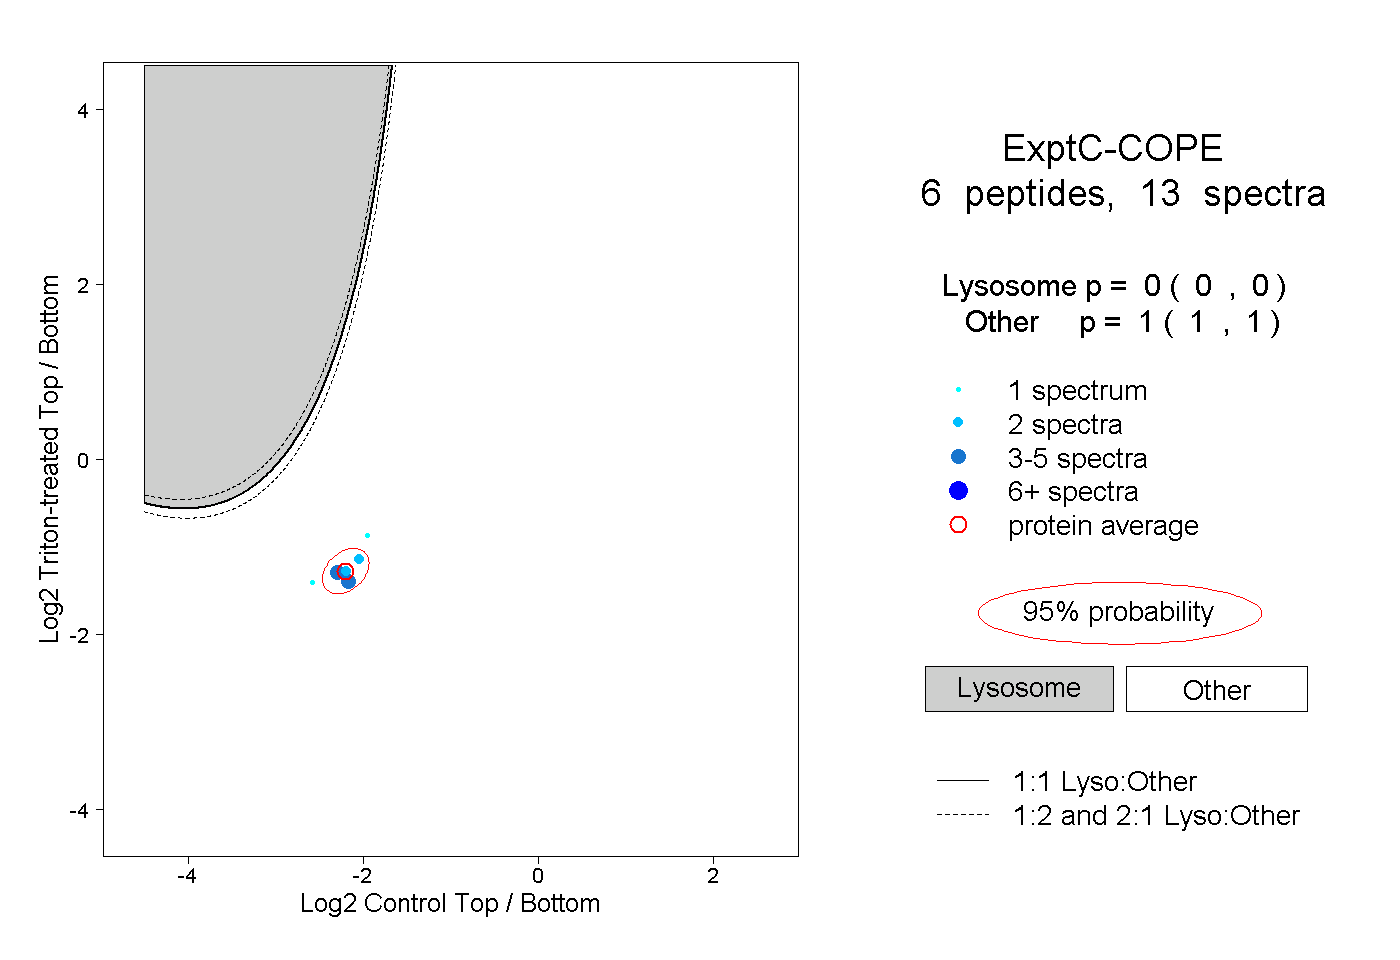 |
0.000 0.000 | 0.000 |
1.000 1.000 | 1.000 |
||||||||
| Plot | Lyso | Other | |||||||||||
| Expt D |
1 peptide |
4 spectra |
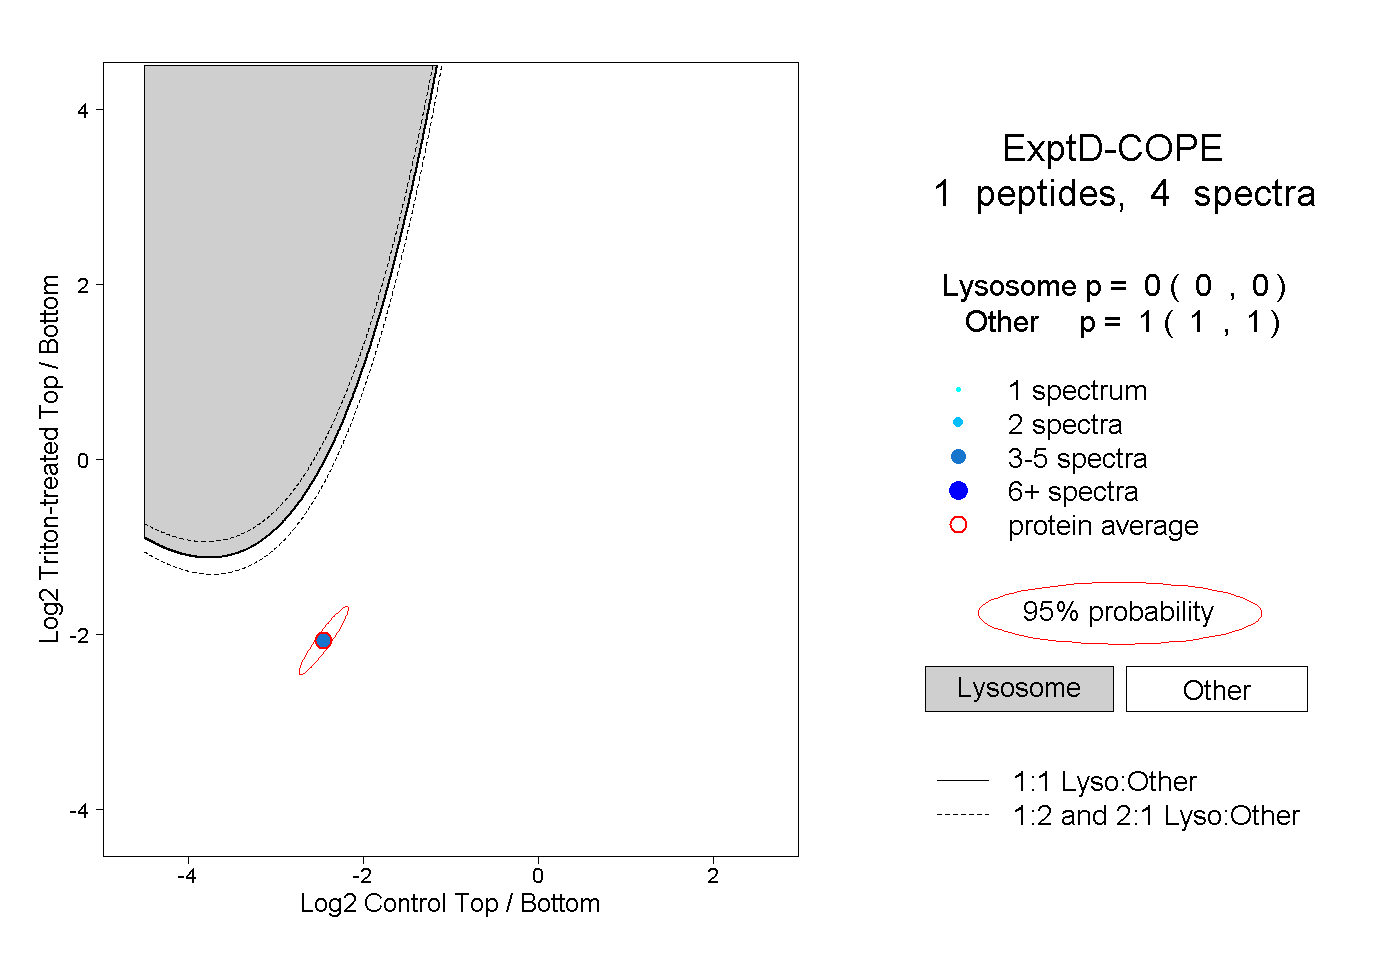 |
0.000 0.000 | 0.000 |
1.000 1.000 | 1.000 |