 6
6peptides
spectra
0.018 | 0.052
0.000 | 0.000
0.000 | 0.004
0.284 | 0.357
0.288 | 0.366
0.000 | 0.000
0.290 | 0.323
0.000 | 0.000
1peptide
spectra
NA | NA
NA | NA
NA | NA
NA | NA
NA | NA
NA | NA
NA | NA
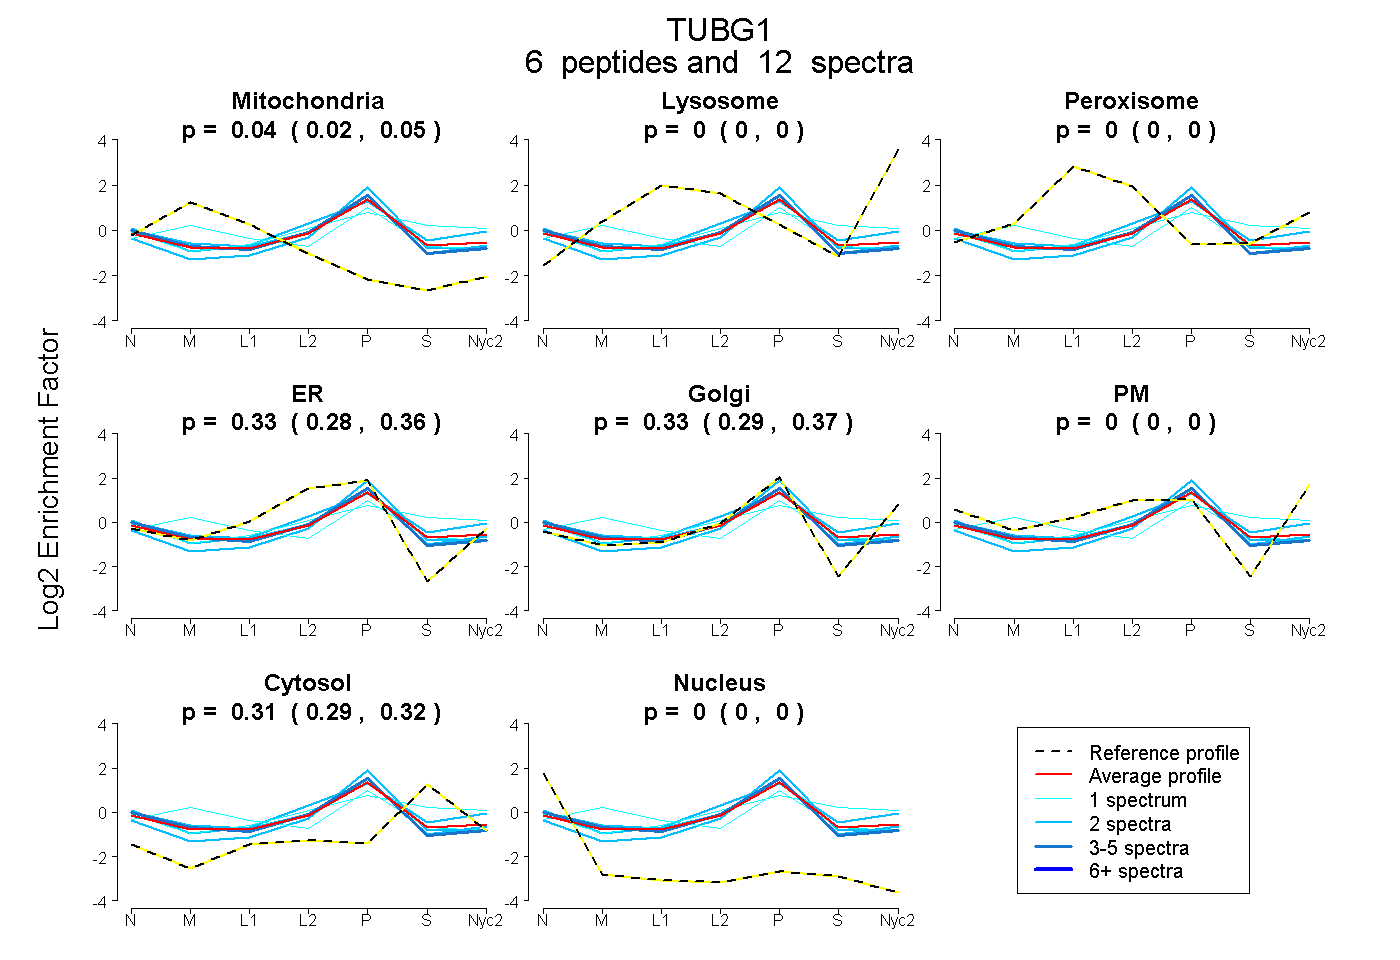
| Plot | Mito | Lyso | Perox | ER | Golgi | PM | Cytosol | Nucleus | |||||
| Expt A |
6 peptides |
12 spectra |
|
0.036 0.018 | 0.052 |
0.000 0.000 | 0.000 |
0.000 0.000 | 0.004 |
0.326 0.284 | 0.357 |
0.330 0.288 | 0.366 |
0.000 0.000 | 0.000 |
0.308 0.290 | 0.323 |
0.000 0.000 | 0.000 |
||
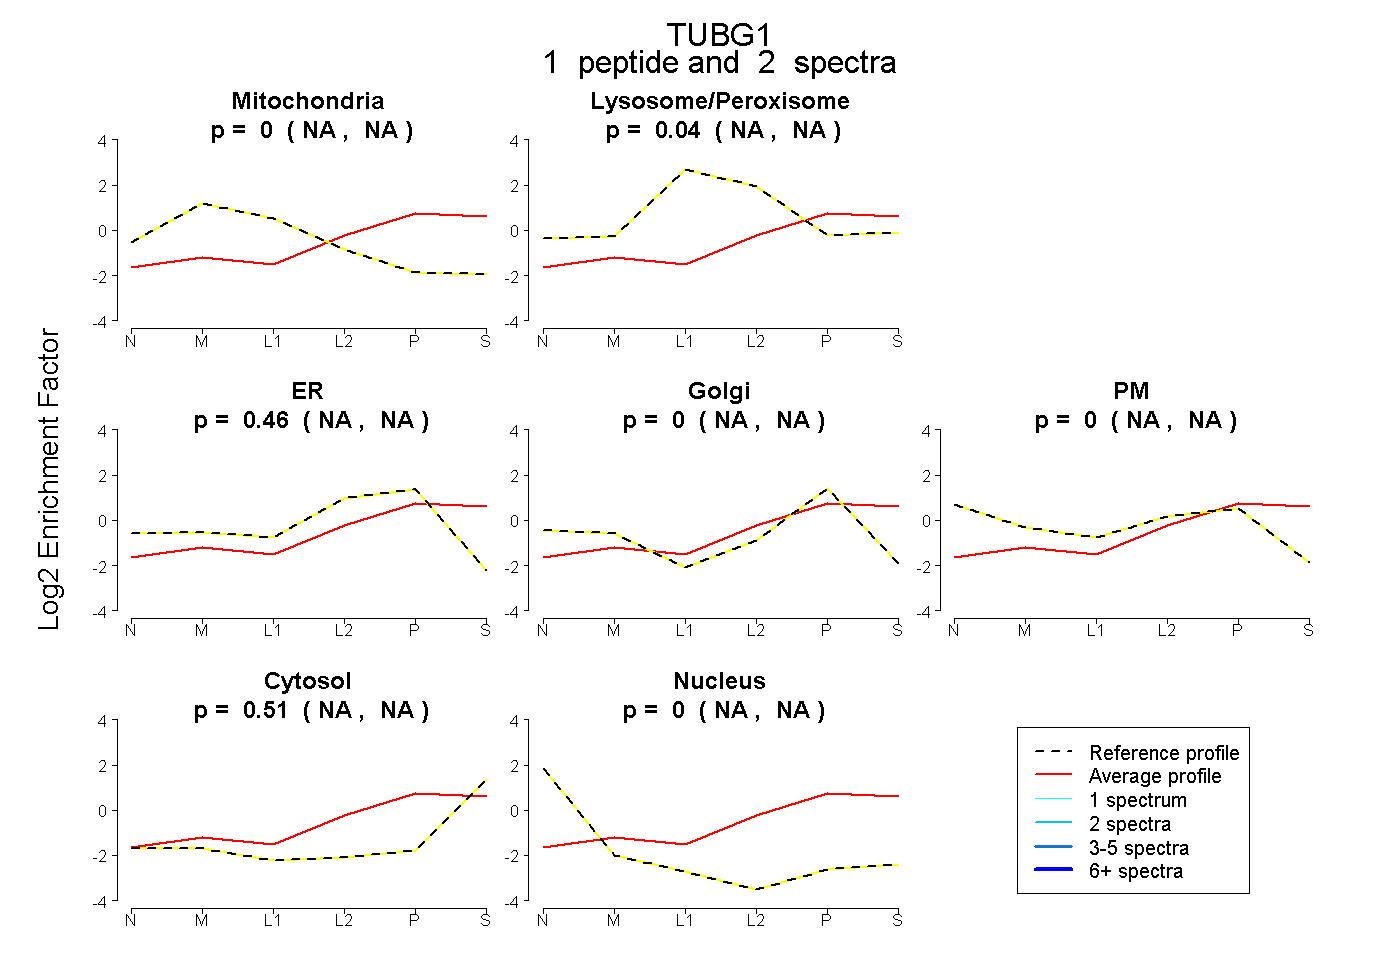
| Plot | Mito | Lyso or Perox | ER | Golgi | PM | Cytosol | Nucleus | ||||||
| Expt B |
1 peptide |
2 spectra |
|
0.000 NA | NA |
0.037 NA | NA |
0.457 NA | NA |
0.000 NA | NA |
0.000 NA | NA |
0.506 NA | NA |
0.000 NA | NA |