 2
2peptides
spectra
0.000 | 0.000
0.333 | 0.480
0.000 | 0.252
0.000 | 0.215
0.000 | 0.018
0.235 | 0.461
0.000 | 0.014
0.000 | 0.000
5peptides
spectra
0.002 | 1.000
0.000 | 0.997
| Plot | Mito | Lyso | Perox | ER | Golgi | PM | Cytosol | Nucleus | |||||
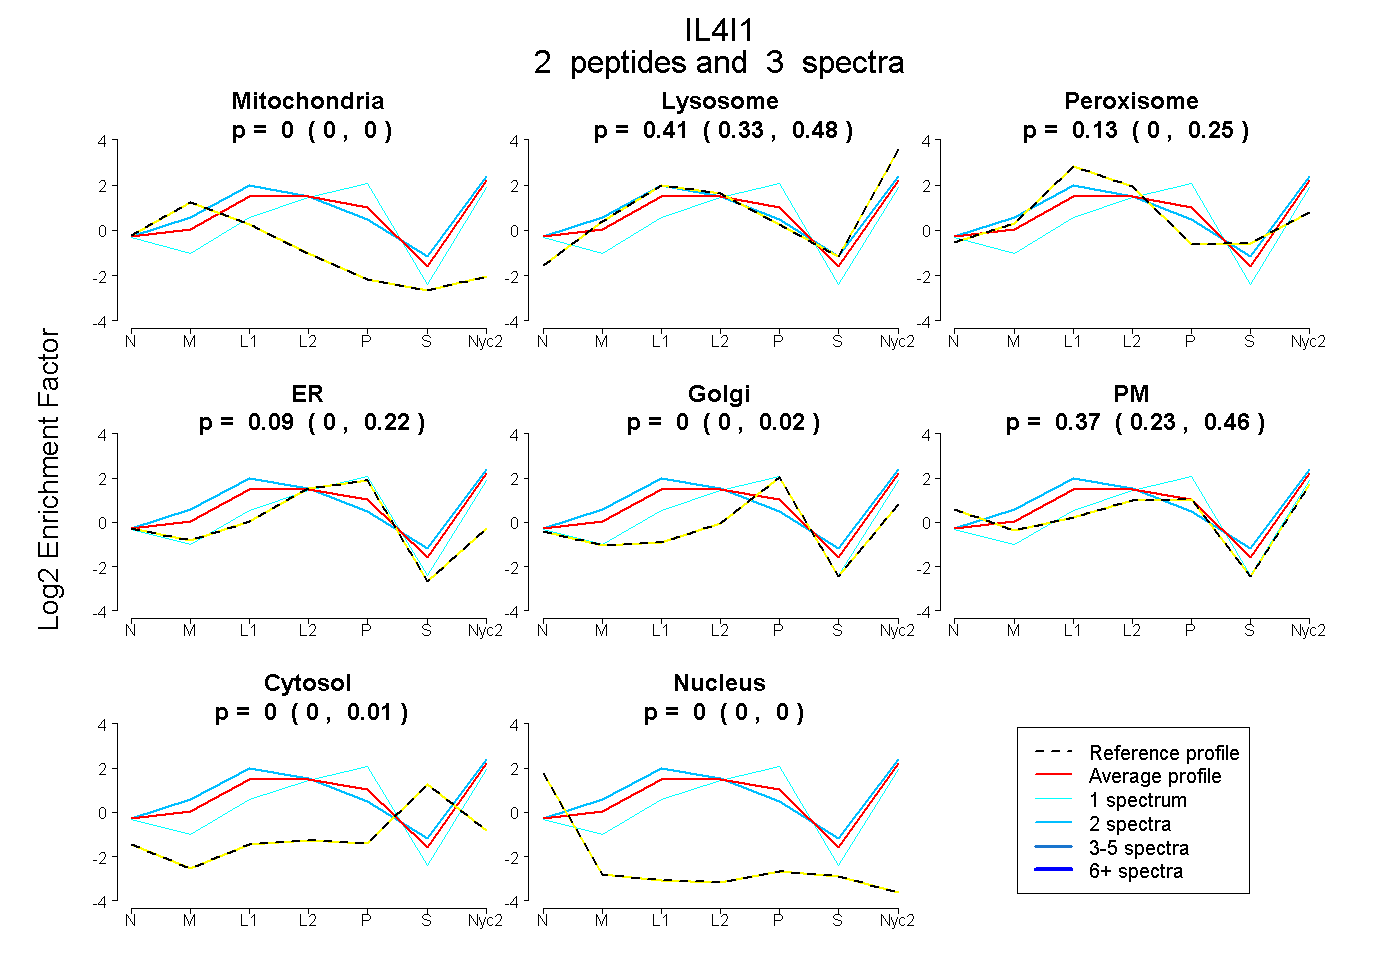
| Expt A |
2 peptides |
3 spectra |
|
0.000 0.000 | 0.000 |
0.410 0.333 | 0.480 |
0.125 0.000 | 0.252 |
0.092 0.000 | 0.215 |
0.000 0.000 | 0.018 |
0.372 0.235 | 0.461 |
0.000 0.000 | 0.014 |
0.000 0.000 | 0.000 |
||
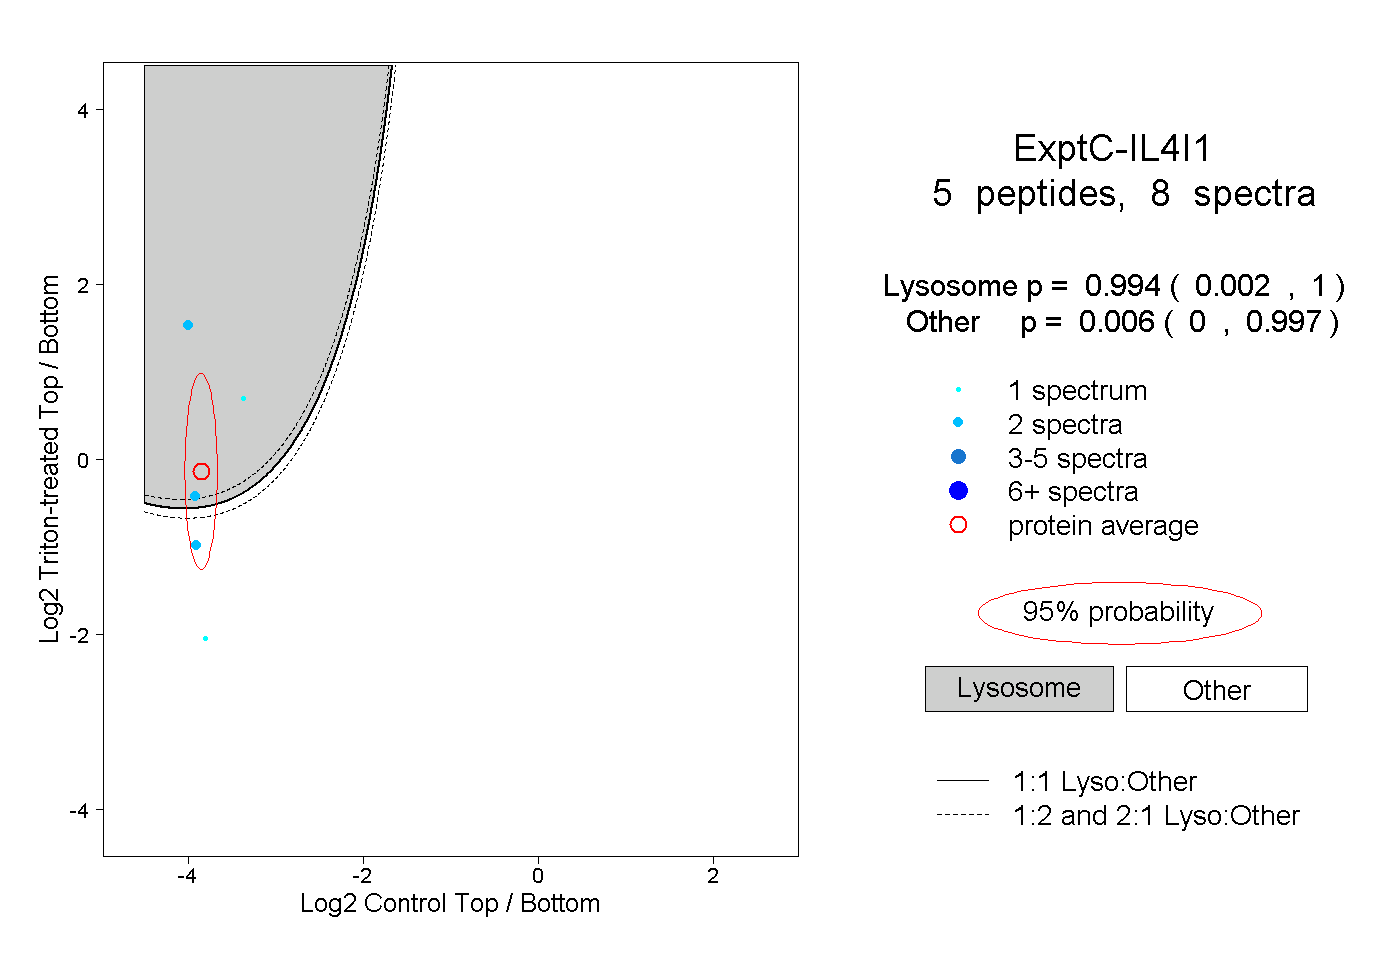
| Plot | Lyso | Other | |||||||||||
| Expt C |
5 peptides |
8 spectra |
|
0.994 0.002 | 1.000 |
0.006 0.000 | 0.997 |