 4
4peptides
spectra
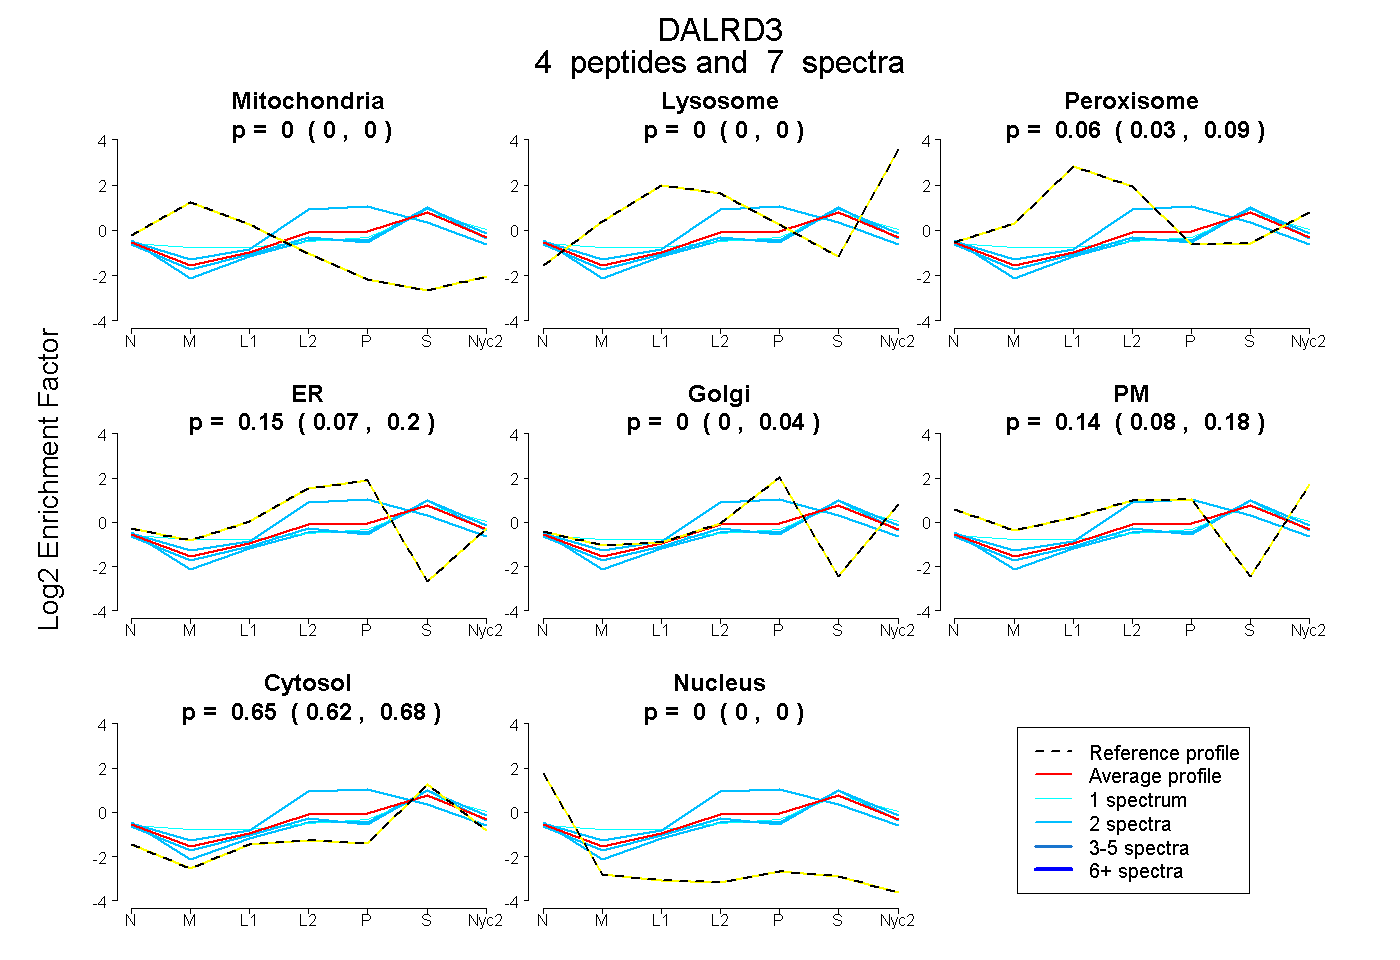
0.000 | 0.000
0.000 | 0.000
0.028 | 0.091
0.066 | 0.203
0.000 | 0.045
0.079 | 0.184
0.618 | 0.677
0.000 | 0.000
1peptide
spectra
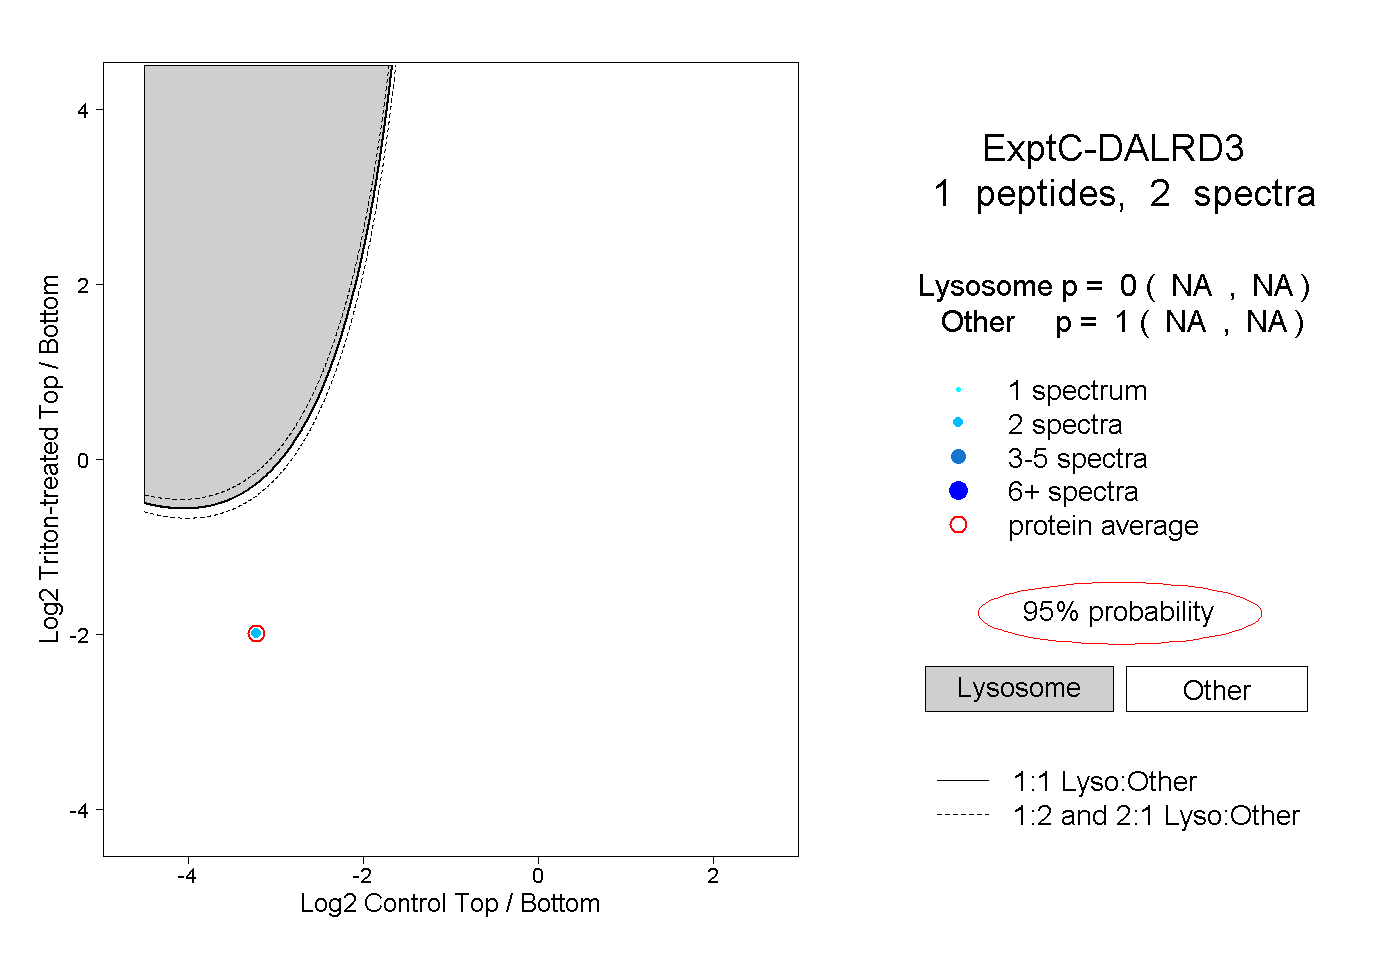
NA | NA
NA | NA
| Plot | Mito | Lyso | Perox | ER | Golgi | PM | Cytosol | Nucleus | |||||
| Expt A |
4 peptides |
7 spectra |
|
0.000 0.000 | 0.000 |
0.000 0.000 | 0.000 |
0.060 0.028 | 0.091 |
0.146 0.066 | 0.203 |
0.000 0.000 | 0.045 |
0.141 0.079 | 0.184 |
0.653 0.618 | 0.677 |
0.000 0.000 | 0.000 |
||
| Plot | Lyso | Other | |||||||||||
| Expt C |
1 peptide |
2 spectra |
|
0.000 NA | NA |
1.000 NA | NA |