 38
38peptides
spectra
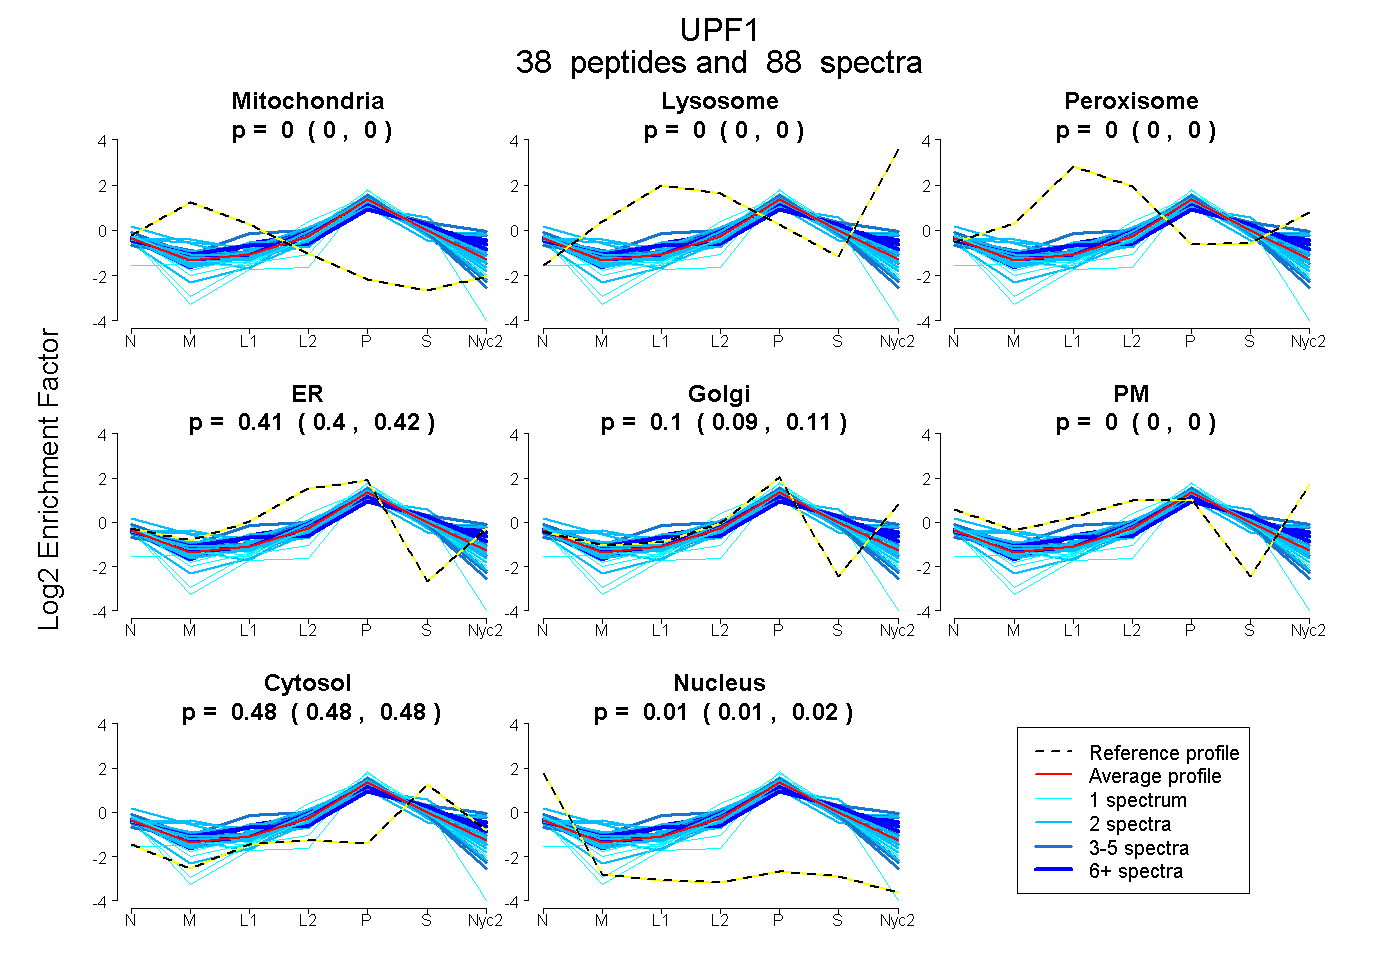
0.000 | 0.000
0.000 | 0.000
0.000 | 0.000
0.403 | 0.417
0.087 | 0.105
0.000 | 0.000
0.478 | 0.481
0.011 | 0.015
20peptides
spectra
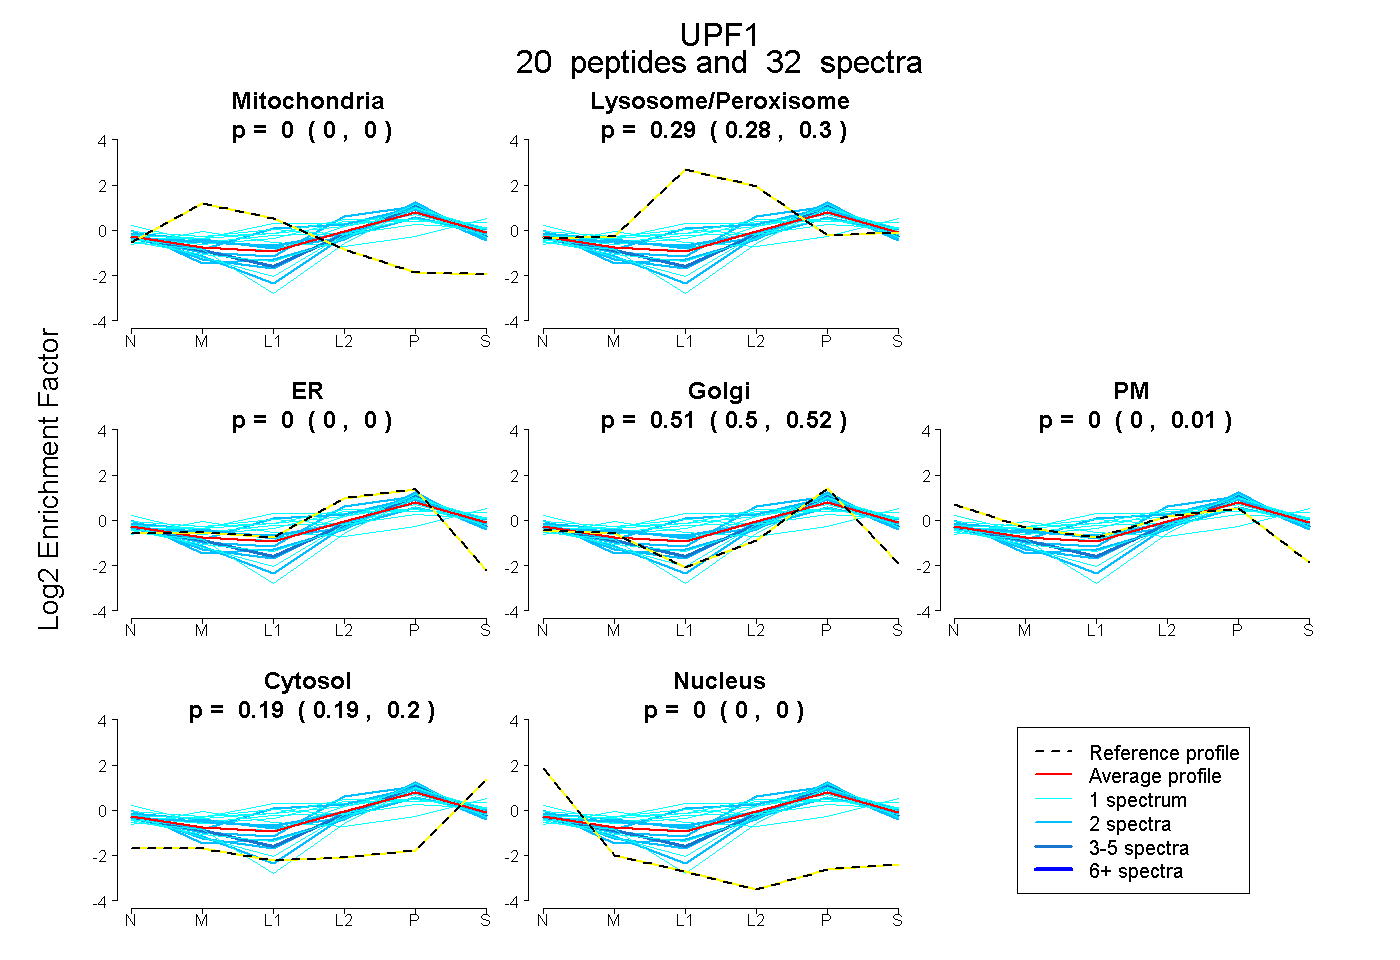
0.000 | 0.000
0.284 | 0.302
0.000 | 0.000
0.502 | 0.519
0.000 | 0.006
0.188 | 0.198
0.000 | 0.000
30peptides
spectra
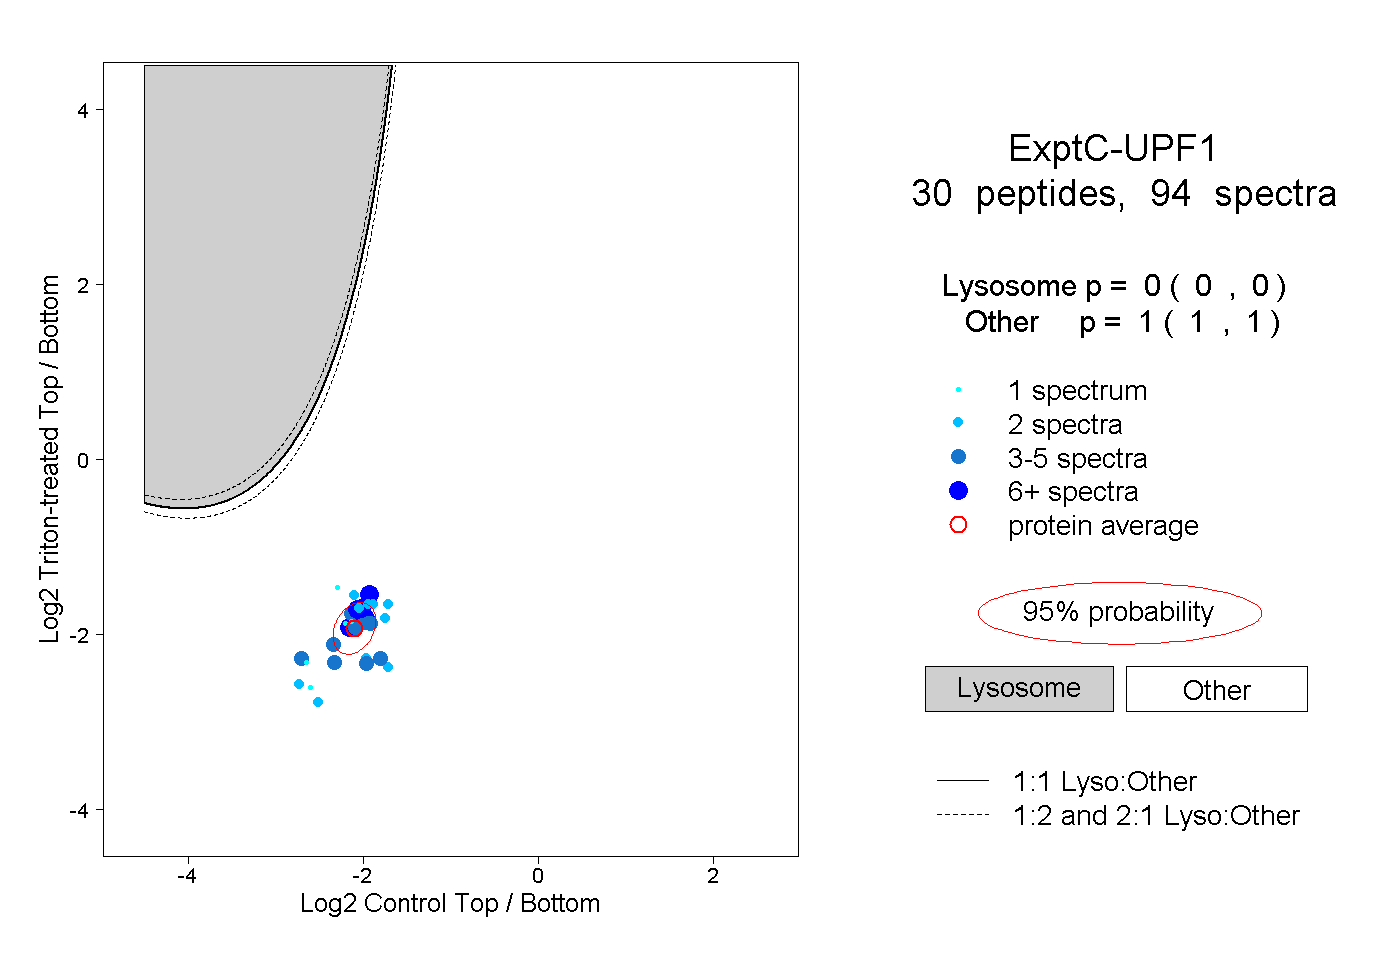
0.000 | 0.000
1.000 | 1.000
8peptides
spectra
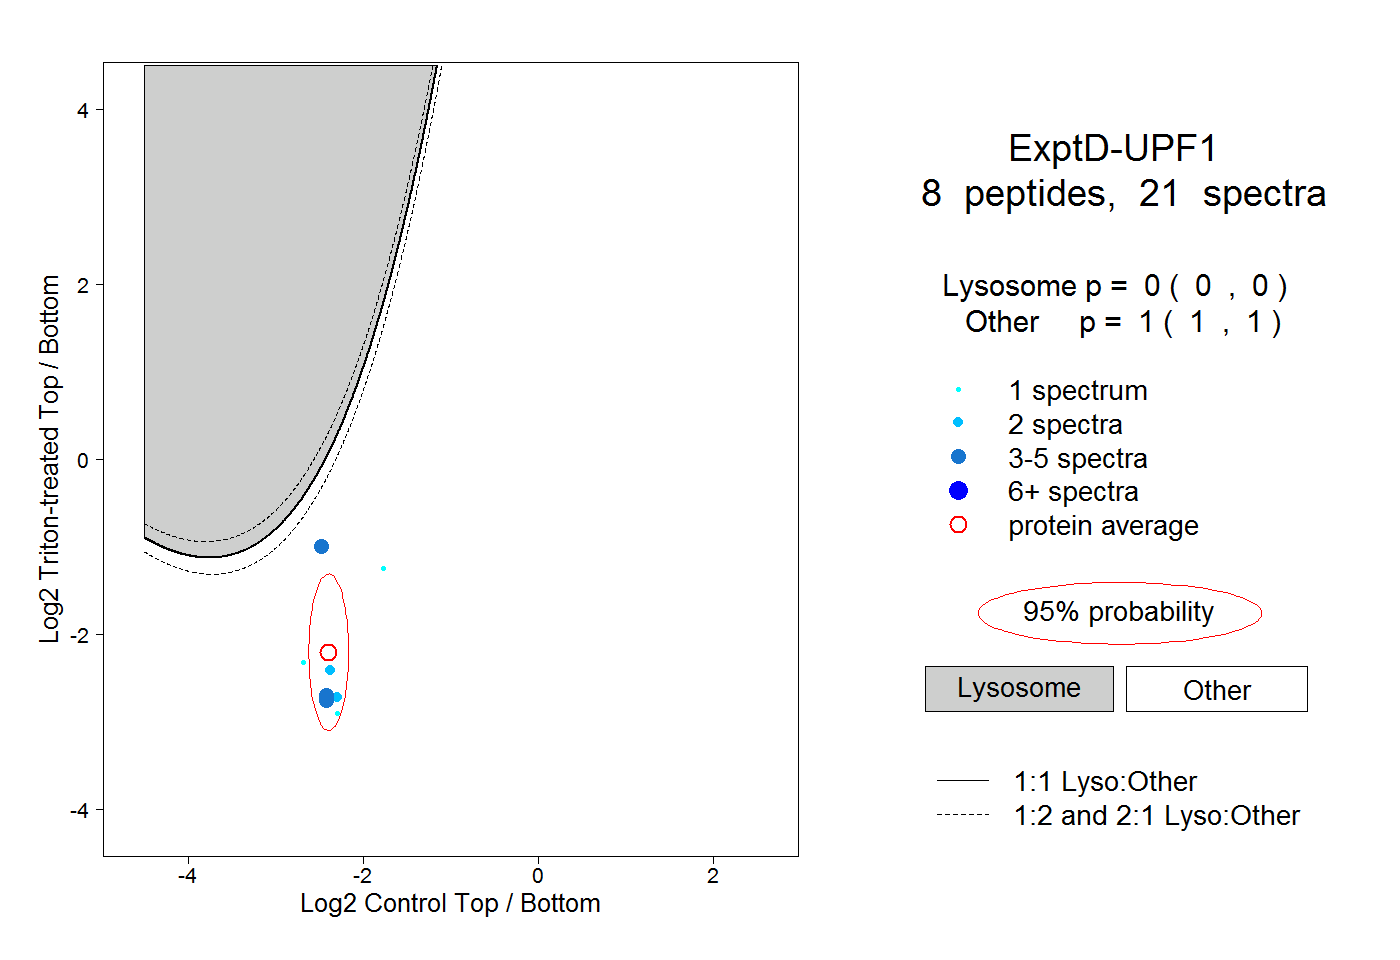
0.000 | 0.000
1.000 | 1.000