18
18peptides
spectra
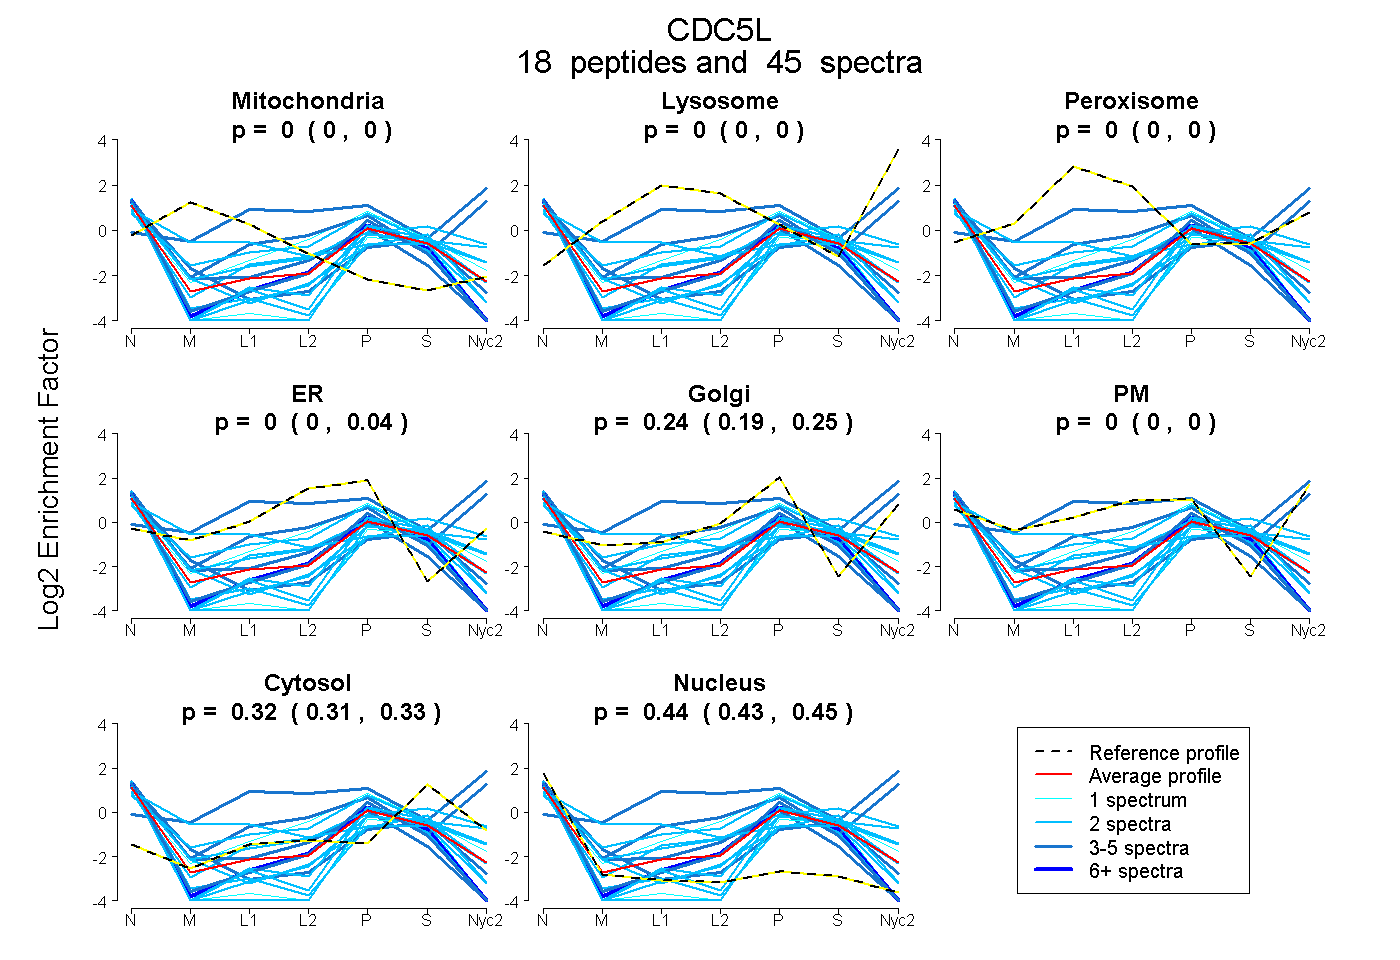
0.000 | 0.000
0.000 | 0.000
0.000 | 0.000
0.000 | 0.041
0.187 | 0.249
0.000 | 0.000
0.315 | 0.327
0.425 | 0.447
6peptides
spectra
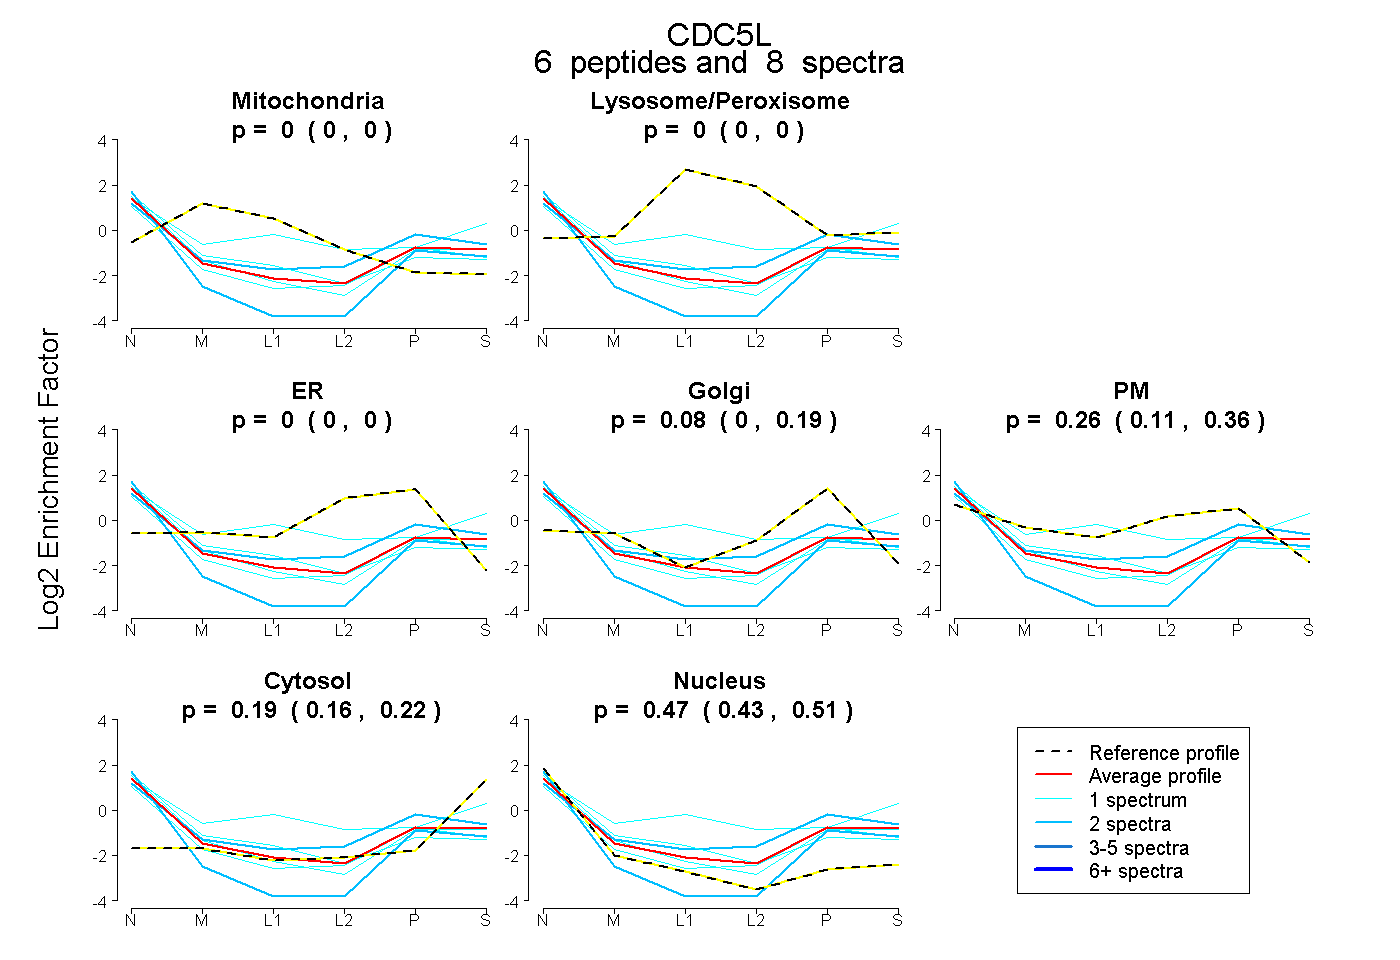
0.000 | 0.000
0.000 | 0.000
0.000 | 0.000
0.000 | 0.186
0.109 | 0.362
0.155 | 0.216
0.426 | 0.511