 18
18peptides
spectra
0.000 | 0.000
0.000 | 0.000
0.000 | 0.000
0.000 | 0.041
0.187 | 0.249
0.000 | 0.000
0.315 | 0.327
0.425 | 0.447
| Plot | Mito | Lyso | Perox | ER | Golgi | PM | Cytosol | Nucleus | |||||
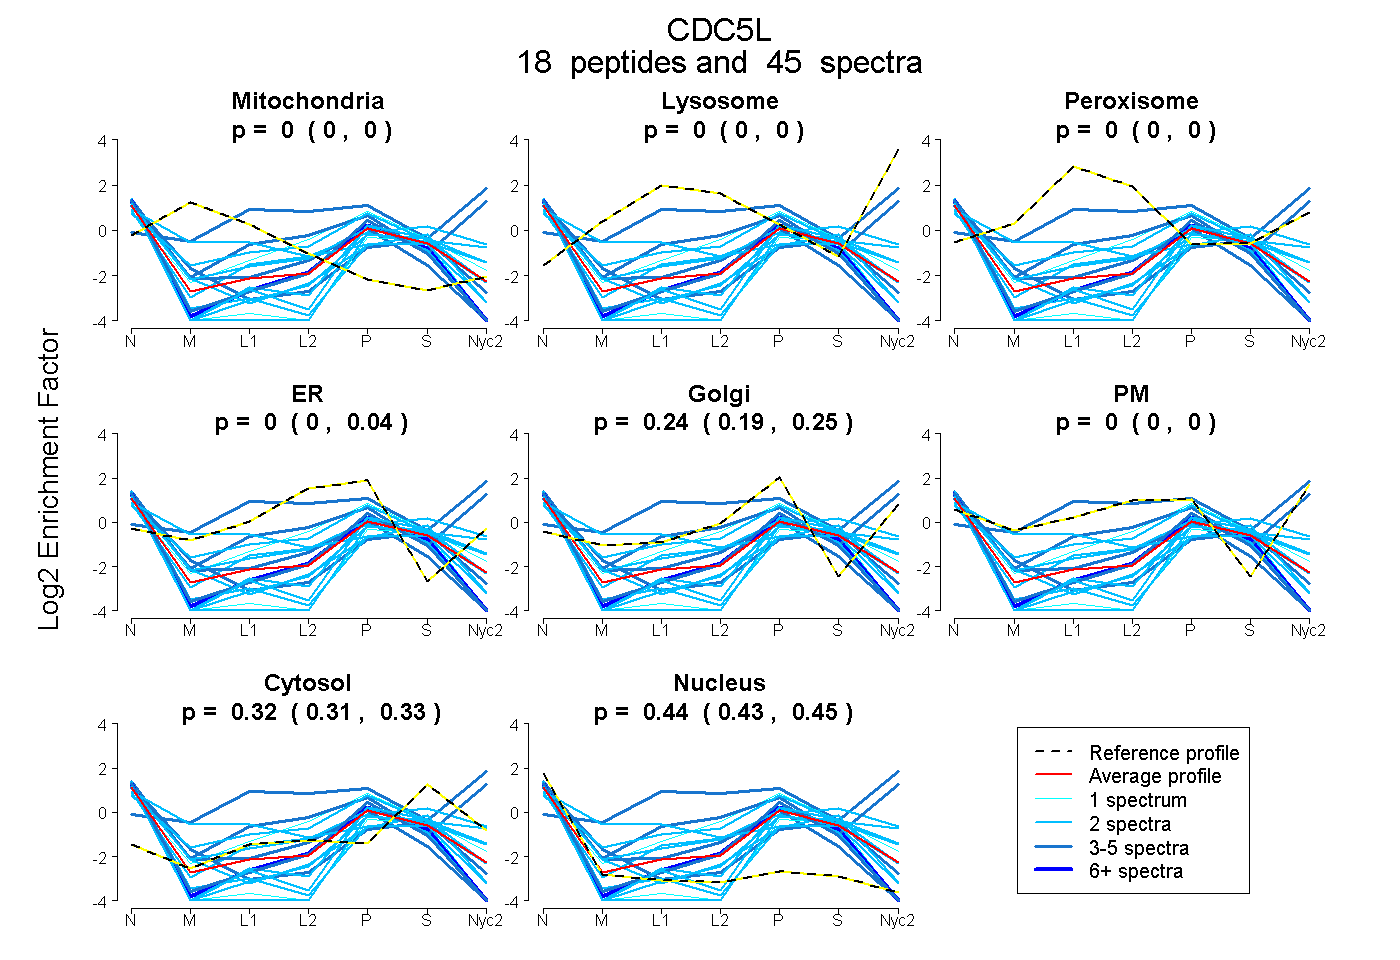
| Expt A |
18 peptides |
45 spectra |
|
0.000 0.000 | 0.000 |
0.000 0.000 | 0.000 |
0.000 0.000 | 0.000 |
0.004 0.000 | 0.041 |
0.238 0.187 | 0.249 |
0.000 0.000 | 0.000 |
0.321 0.315 | 0.327 |
0.437 0.425 | 0.447 |
| 2 spectra, AMGLLK | 0.000 | 0.000 | 0.000 | 0.000 | 0.127 | 0.149 | 0.532 | 0.192 | ||
| 2 spectra, QLNDLWDQIEQAHLELR | 0.000 | 0.000 | 0.000 | 0.000 | 0.140 | 0.000 | 0.397 | 0.463 | ||
| 3 spectra, LMPTQWR | 0.000 | 0.000 | 0.000 | 0.000 | 0.046 | 0.625 | 0.265 | 0.065 | ||
| 2 spectra, QQDLDGELR | 0.000 | 0.000 | 0.000 | 0.010 | 0.059 | 0.000 | 0.247 | 0.685 | ||
| 2 spectra, NTEDEILK | 0.000 | 0.000 | 0.000 | 0.114 | 0.180 | 0.057 | 0.339 | 0.311 | ||
| 1 spectrum, IAALQK | 0.000 | 0.000 | 0.000 | 0.428 | 0.000 | 0.000 | 0.360 | 0.212 | ||
| 2 spectra, WYEWLDPSIK | 0.000 | 0.000 | 0.000 | 0.150 | 0.215 | 0.146 | 0.344 | 0.145 | ||
| 3 spectra, ADLASK | 0.000 | 0.297 | 0.151 | 0.000 | 0.112 | 0.303 | 0.137 | 0.000 | ||
| 6 spectra, LLHLAK | 0.000 | 0.000 | 0.000 | 0.128 | 0.000 | 0.000 | 0.252 | 0.620 | ||
| 3 spectra, TIAPIIGR | 0.000 | 0.000 | 0.000 | 0.173 | 0.000 | 0.000 | 0.193 | 0.634 | ||
| 3 spectra, AQDVLVQEMEVVK | 0.000 | 0.000 | 0.000 | 0.000 | 0.096 | 0.000 | 0.329 | 0.575 | ||
| 5 spectra, IASLLHR | 0.000 | 0.000 | 0.000 | 0.319 | 0.000 | 0.000 | 0.059 | 0.622 | ||
| 2 spectra, SGTTPKPVTNATPGR | 0.000 | 0.000 | 0.000 | 0.000 | 0.000 | 0.000 | 0.270 | 0.730 | ||
| 2 spectra, TPASQDR | 0.000 | 0.000 | 0.000 | 0.000 | 0.088 | 0.000 | 0.379 | 0.533 | ||
| 2 spectra, ILLGGYQSR | 0.000 | 0.000 | 0.000 | 0.000 | 0.000 | 0.000 | 0.253 | 0.747 | ||
| 2 spectra, NDFEIVLPENAEK | 0.000 | 0.000 | 0.000 | 0.000 | 0.040 | 0.000 | 0.394 | 0.566 | ||
| 1 spectrum, LGLLGLPAPK | 0.000 | 0.000 | 0.000 | 0.000 | 0.000 | 0.000 | 0.246 | 0.754 | ||
| 2 spectra, YADLLMEK | 0.221 | 0.000 | 0.158 | 0.119 | 0.000 | 0.000 | 0.214 | 0.288 |
| Plot | Mito | Lyso or Perox | ER | Golgi | PM | Cytosol | Nucleus | ||||||
| Expt B |
6 peptides |
8 spectra |
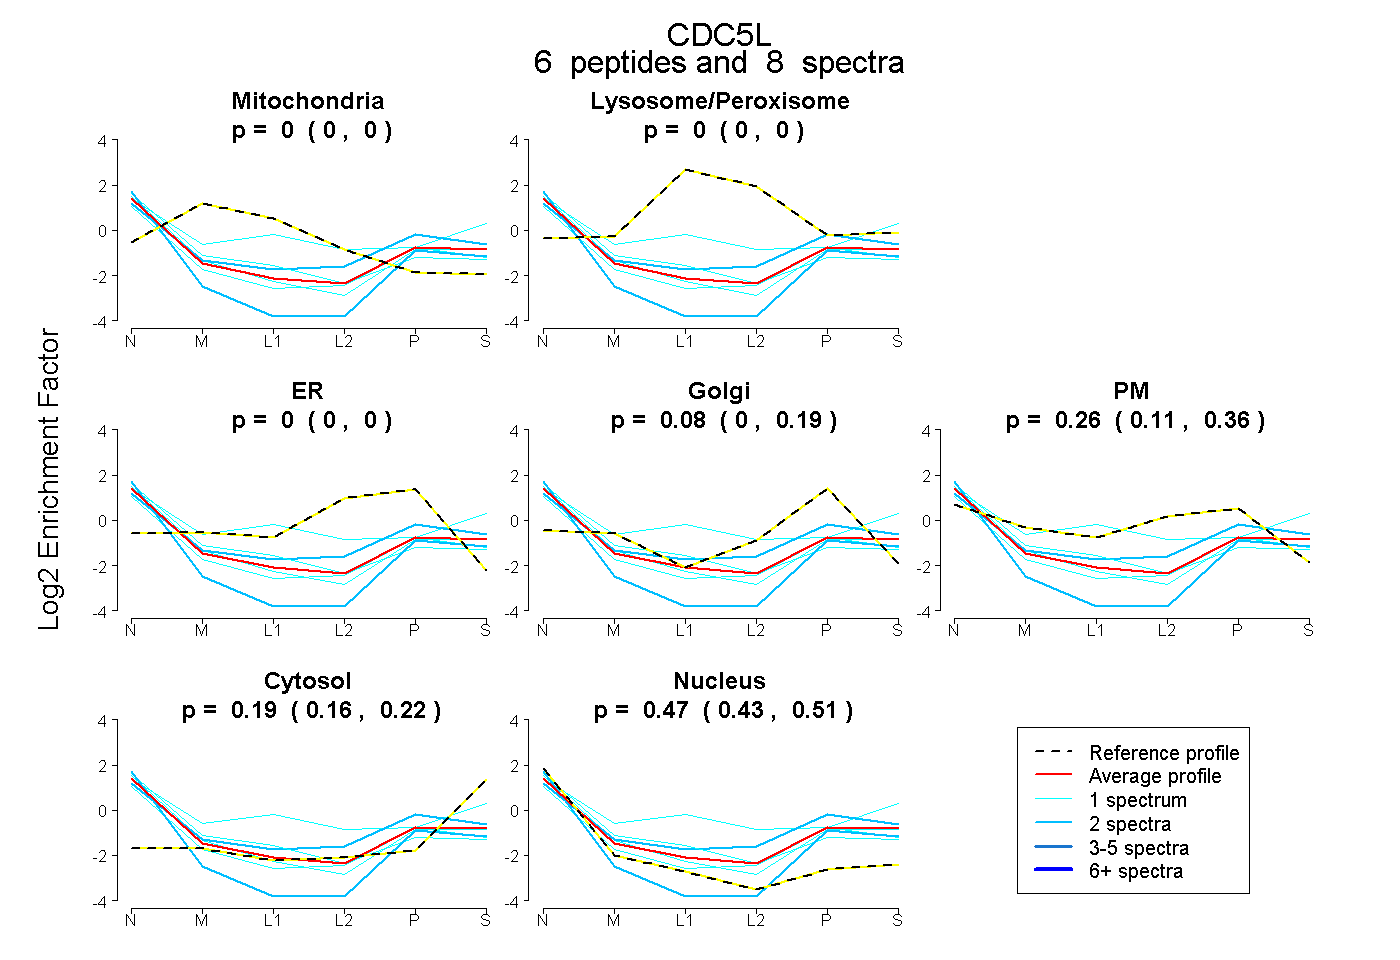 |
0.000 0.000 | 0.000 |
0.000 0.000 | 0.000 |
0.000 0.000 | 0.000 |
0.085 0.000 | 0.186 |
0.256 0.109 | 0.362 |
0.188 0.155 | 0.216 |
0.472 0.426 | 0.511 |
|||
| Plot | Lyso | Other | |||||||||||
| Expt C |
1 peptide |
1 spectrum |
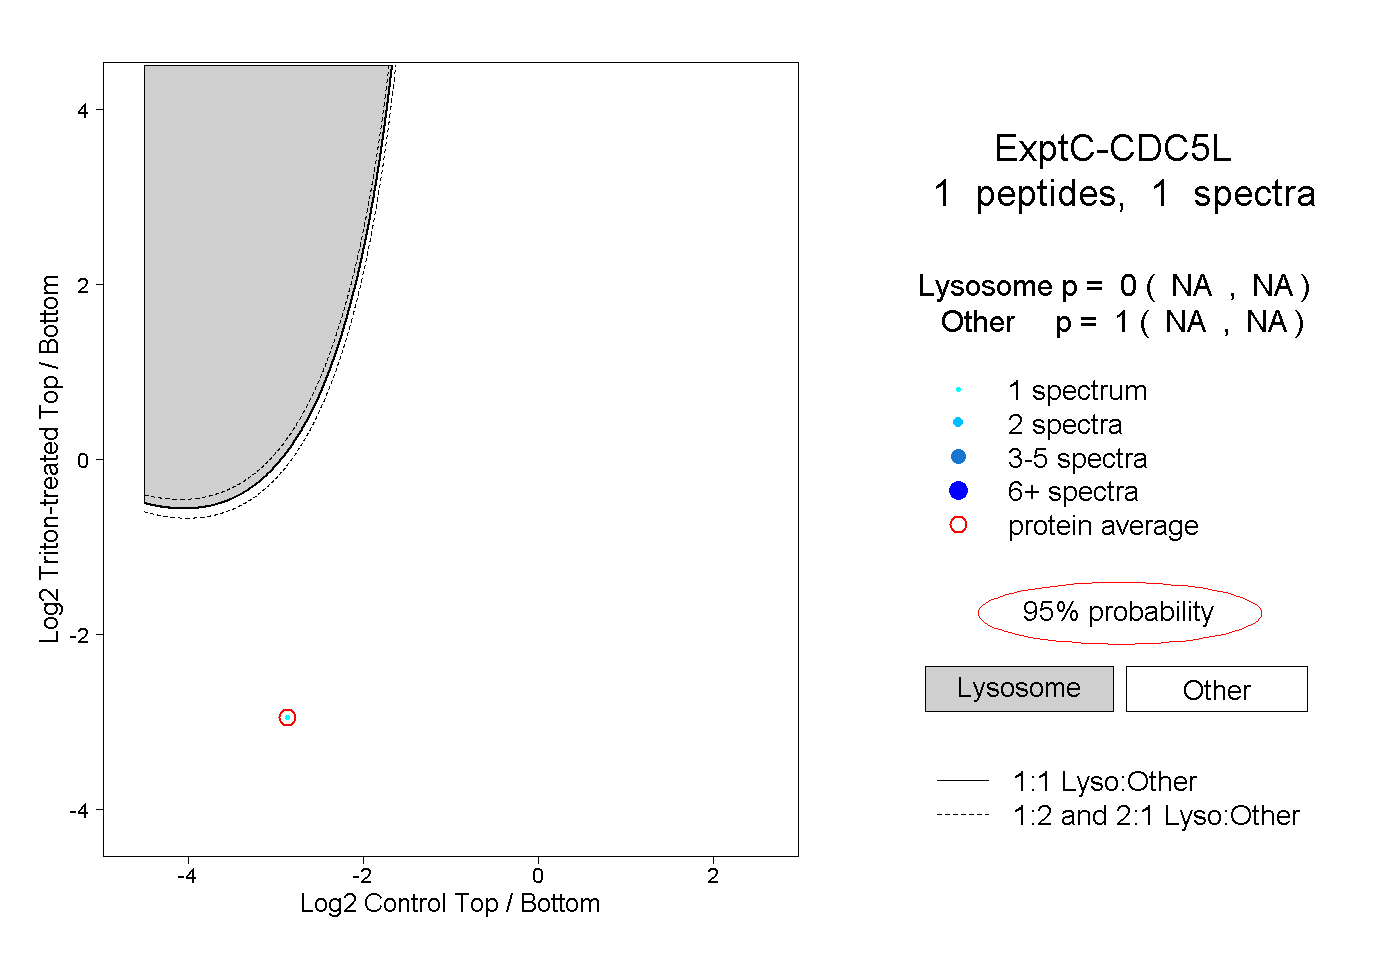 |
0.000 NA | NA |
1.000 NA | NA |