 4
4peptides
spectra
0.509 | 0.578
0.000 | 0.114
0.006 | 0.139
0.000 | 0.000
0.000 | 0.000
0.256 | 0.356
0.000 | 0.000
0.000 | 0.000
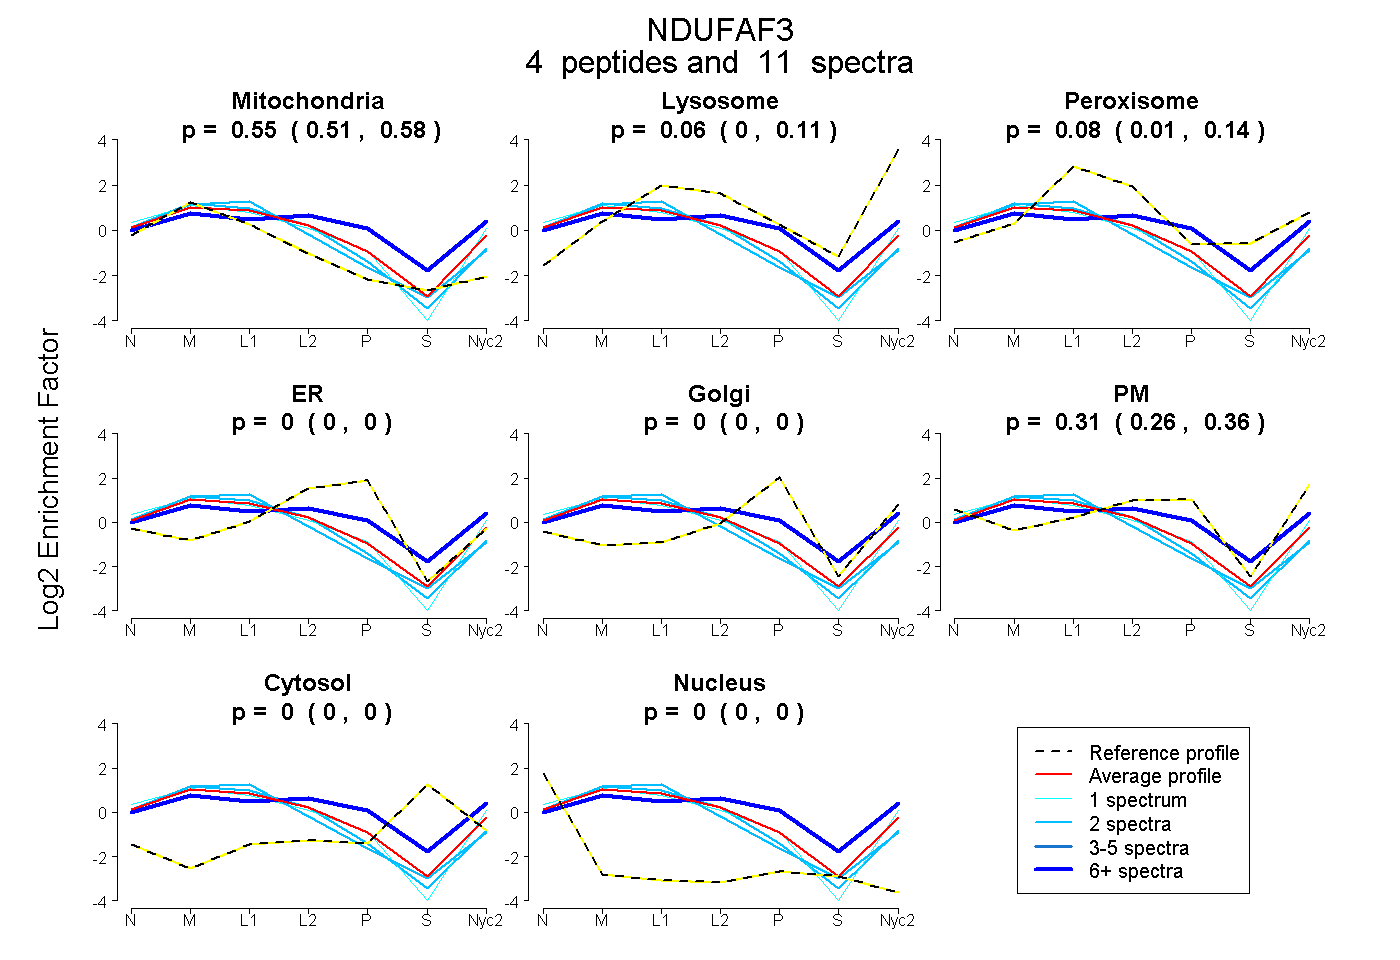
| Plot | Mito | Lyso | Perox | ER | Golgi | PM | Cytosol | Nucleus | |||||
| Expt A |
4 peptides |
11 spectra |
|
0.547 0.509 | 0.578 |
0.062 0.000 | 0.114 |
0.079 0.006 | 0.139 |
0.000 0.000 | 0.000 |
0.000 0.000 | 0.000 |
0.312 0.256 | 0.356 |
0.000 0.000 | 0.000 |
0.000 0.000 | 0.000 |
| 6 spectra, LHSQVLQAMR | 0.293 | 0.081 | 0.166 | 0.043 | 0.067 | 0.350 | 0.000 | 0.000 | ||
| 1 spectrum, IEIVVVGTGNK | 0.537 | 0.004 | 0.000 | 0.000 | 0.000 | 0.459 | 0.000 | 0.000 | ||
| 2 spectra, GFTINGNR | 0.662 | 0.000 | 0.102 | 0.000 | 0.000 | 0.236 | 0.000 | 0.000 | ||
| 2 spectra, LSPADDELYQR | 0.696 | 0.000 | 0.183 | 0.000 | 0.000 | 0.121 | 0.000 | 0.000 |
| Plot | Mito | Lyso or Perox | ER | Golgi | PM | Cytosol | Nucleus | ||||||
| Expt B |
1 peptide |
1 spectrum |
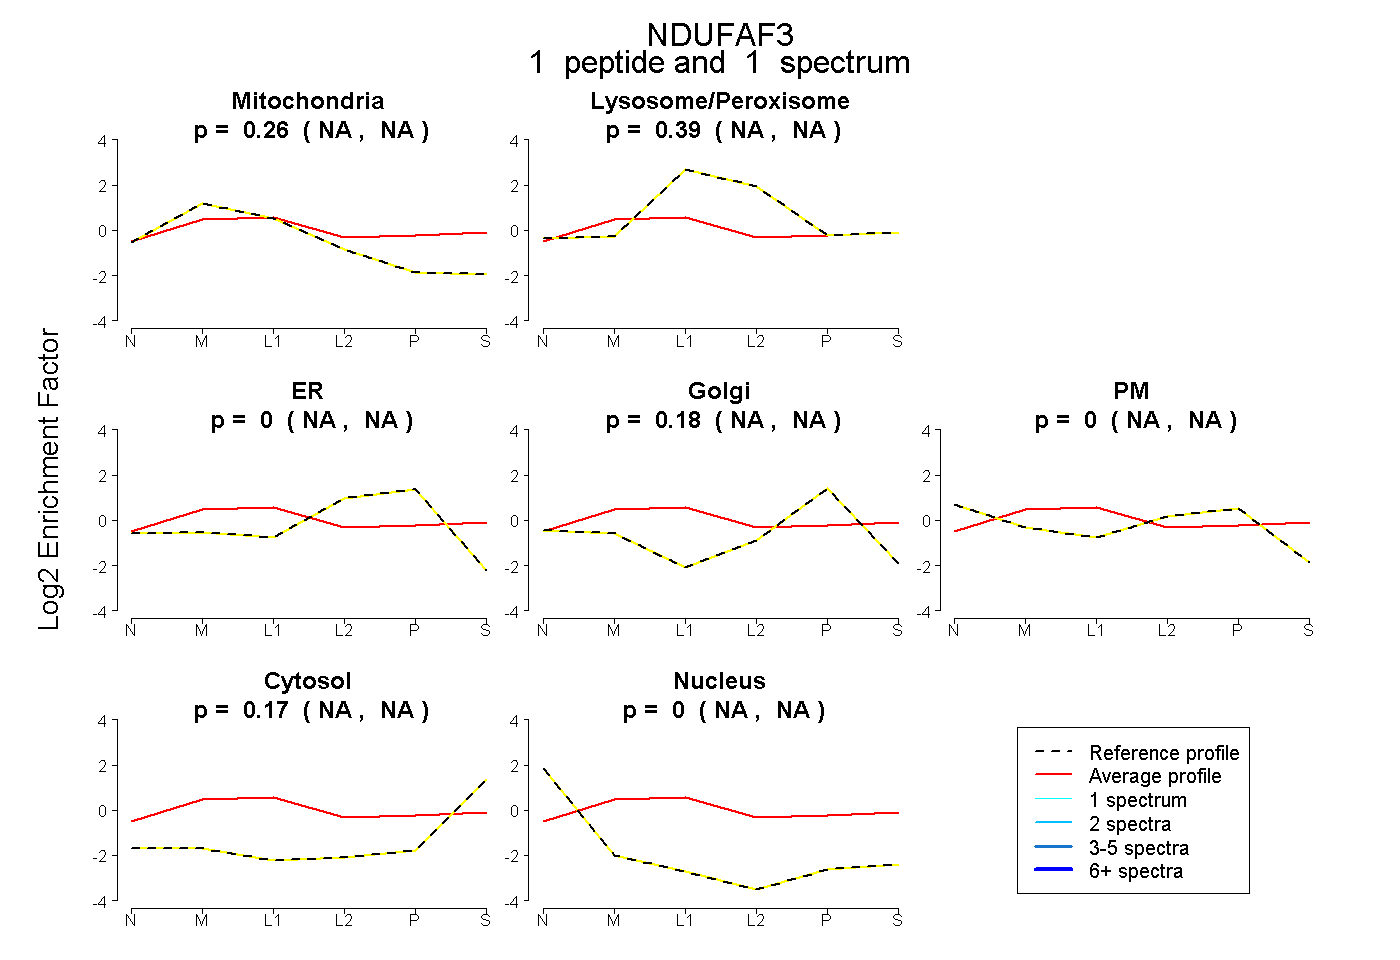 |
0.261 NA | NA |
0.394 NA | NA |
0.000 NA | NA |
0.175 NA | NA |
0.000 NA | NA |
0.171 NA | NA |
0.000 NA | NA |
|||
| Plot | Lyso | Other | |||||||||||
| Expt C |
4 peptides |
11 spectra |
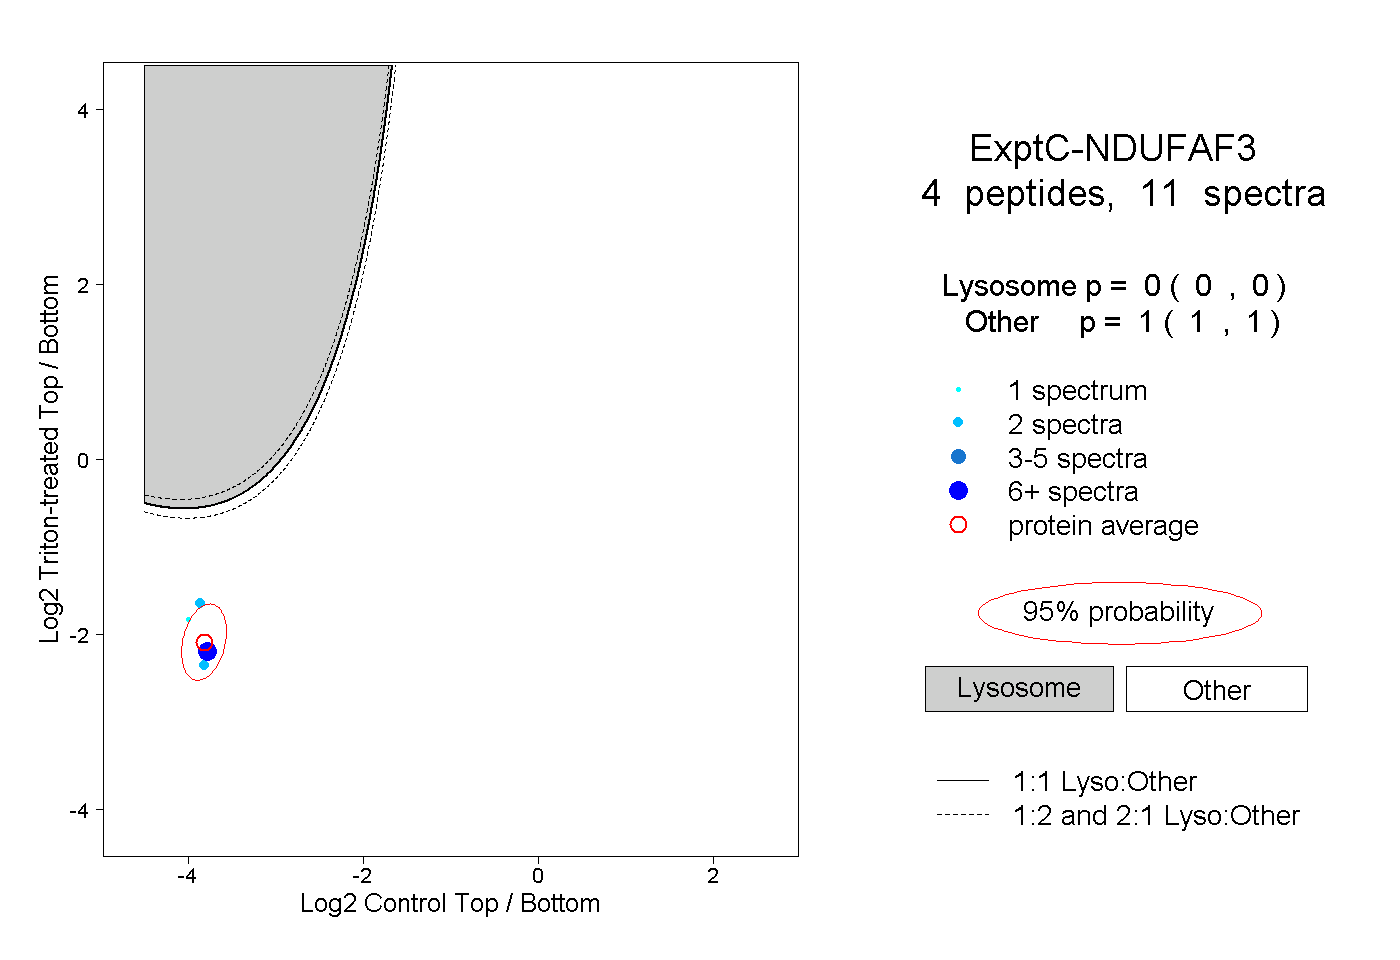 |
0.000 0.000 | 0.000 |
1.000 1.000 | 1.000 |
||||||||
| Plot | Lyso | Other | |||||||||||
| Expt D |
1 peptide |
2 spectra |
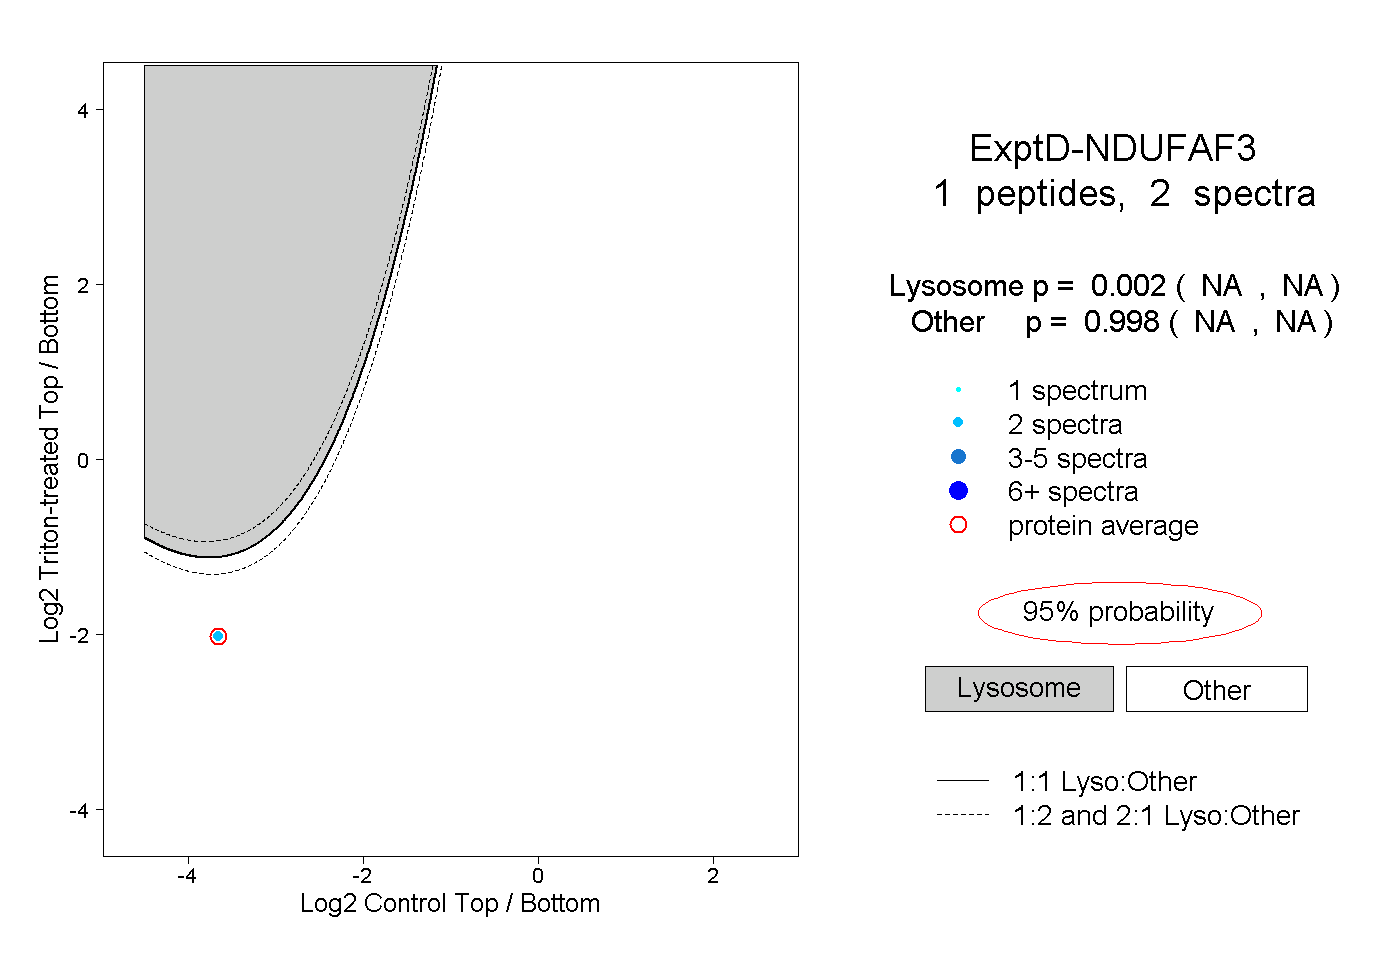 |
0.002 NA | NA |
0.998 NA | NA |