 6
6peptides
spectra
0.048 | 0.059
0.000 | 0.000
0.000 | 0.000
0.833 | 0.846
0.000 | 0.000
0.000 | 0.000
0.049 | 0.066
0.039 | 0.055
3peptides
spectra
0.000 | 0.000
1.000 | 1.000
| Plot | Mito | Lyso | Perox | ER | Golgi | PM | Cytosol | Nucleus | |||||
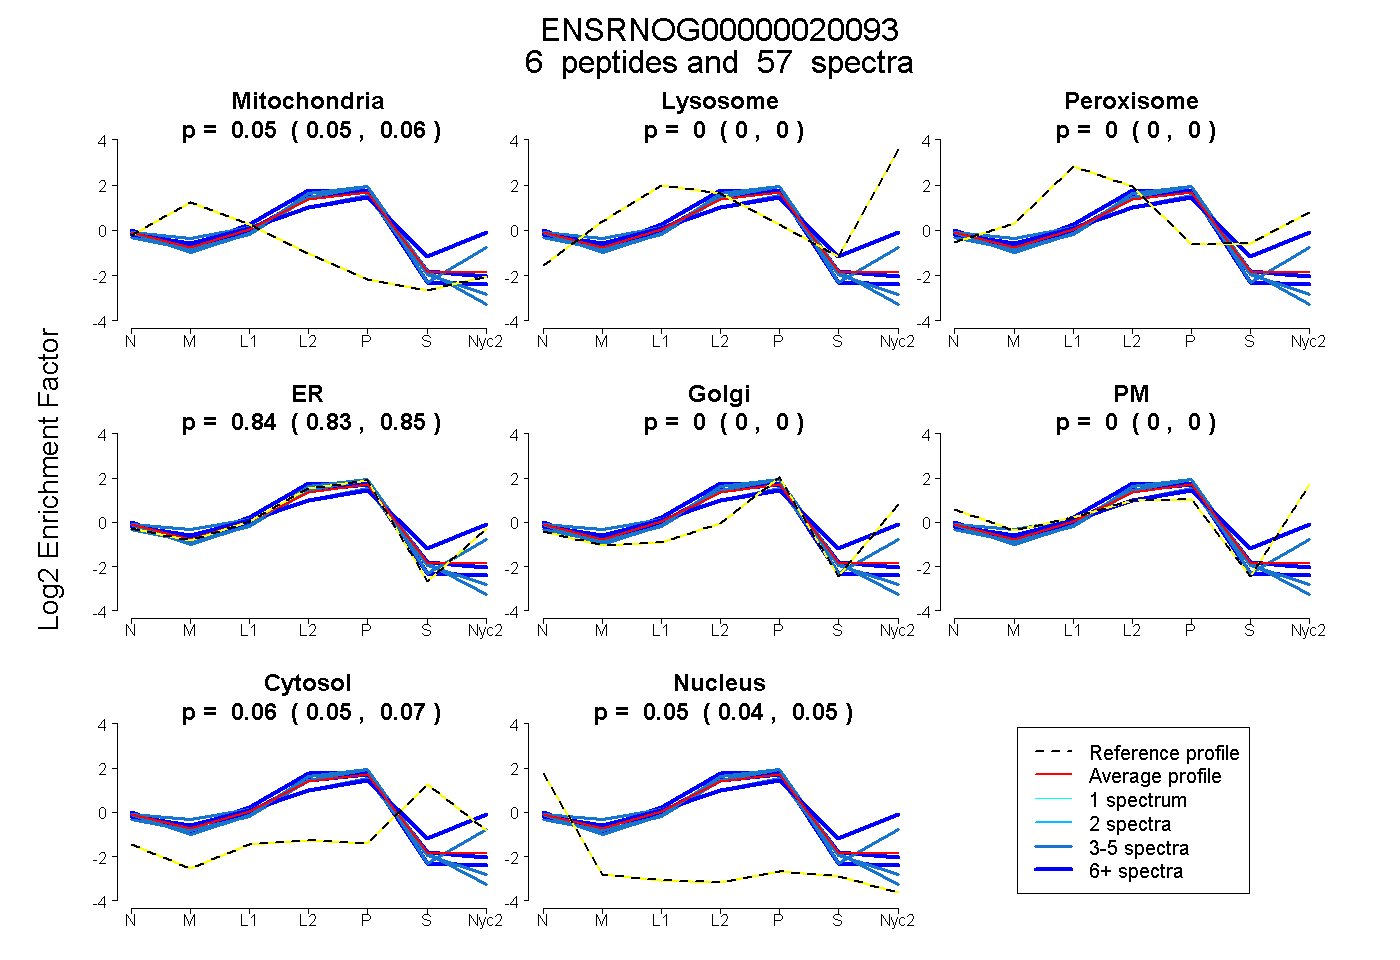
| Expt A |
6 peptides |
57 spectra |
|
0.054 0.048 | 0.059 |
0.000 0.000 | 0.000 |
0.000 0.000 | 0.000 |
0.840 0.833 | 0.846 |
0.000 0.000 | 0.000 |
0.000 0.000 | 0.000 |
0.058 0.049 | 0.066 |
0.048 0.039 | 0.055 |
||
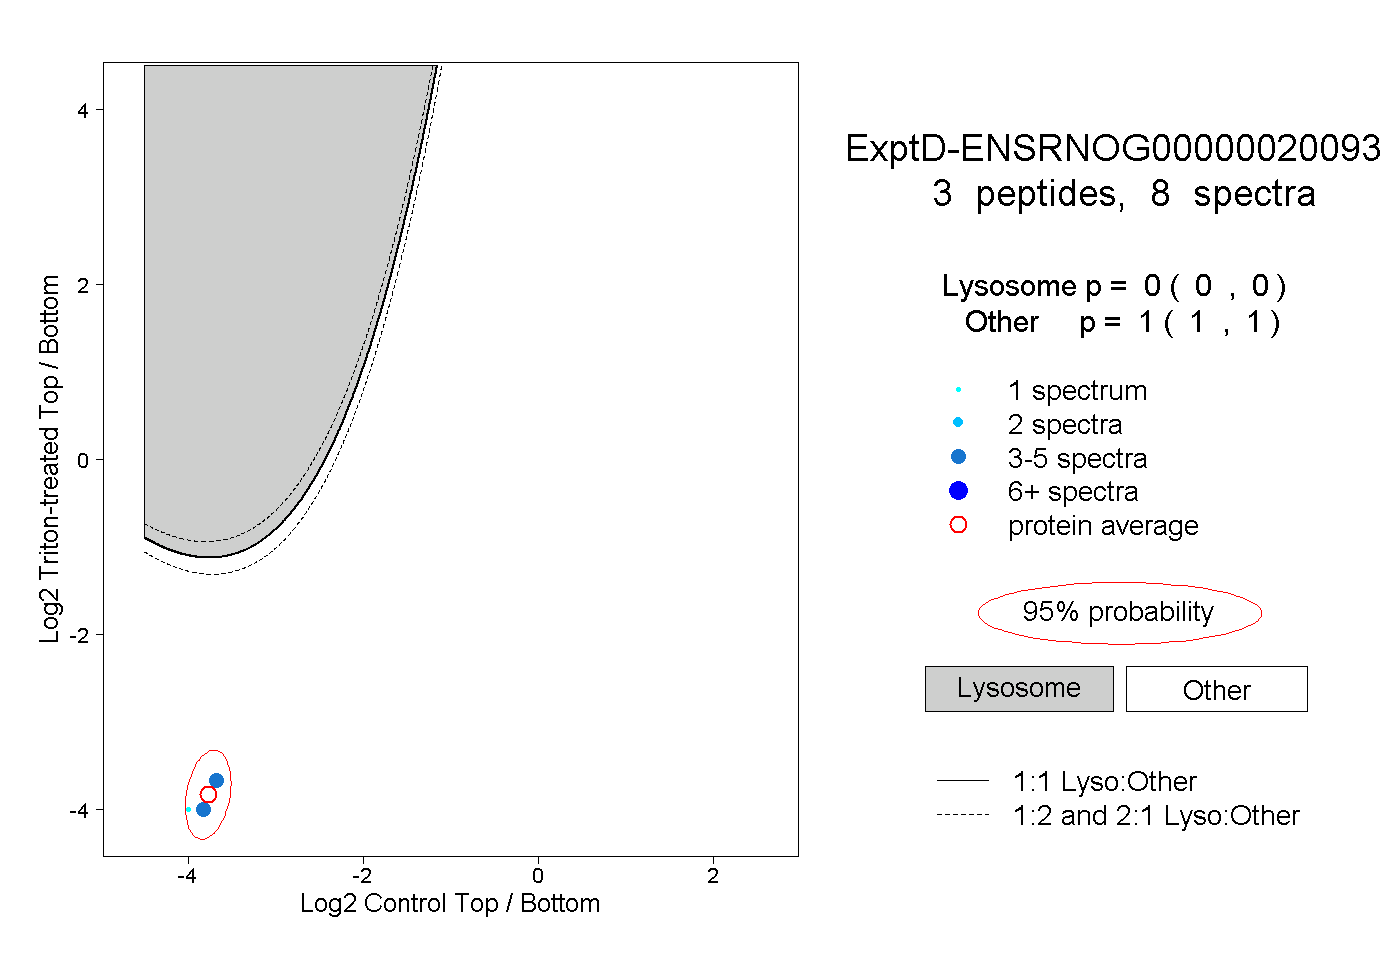
| Plot | Lyso | Other | |||||||||||
| Expt D |
3 peptides |
8 spectra |
|
0.000 0.000 | 0.000 |
1.000 1.000 | 1.000 |