13
13peptides
spectra
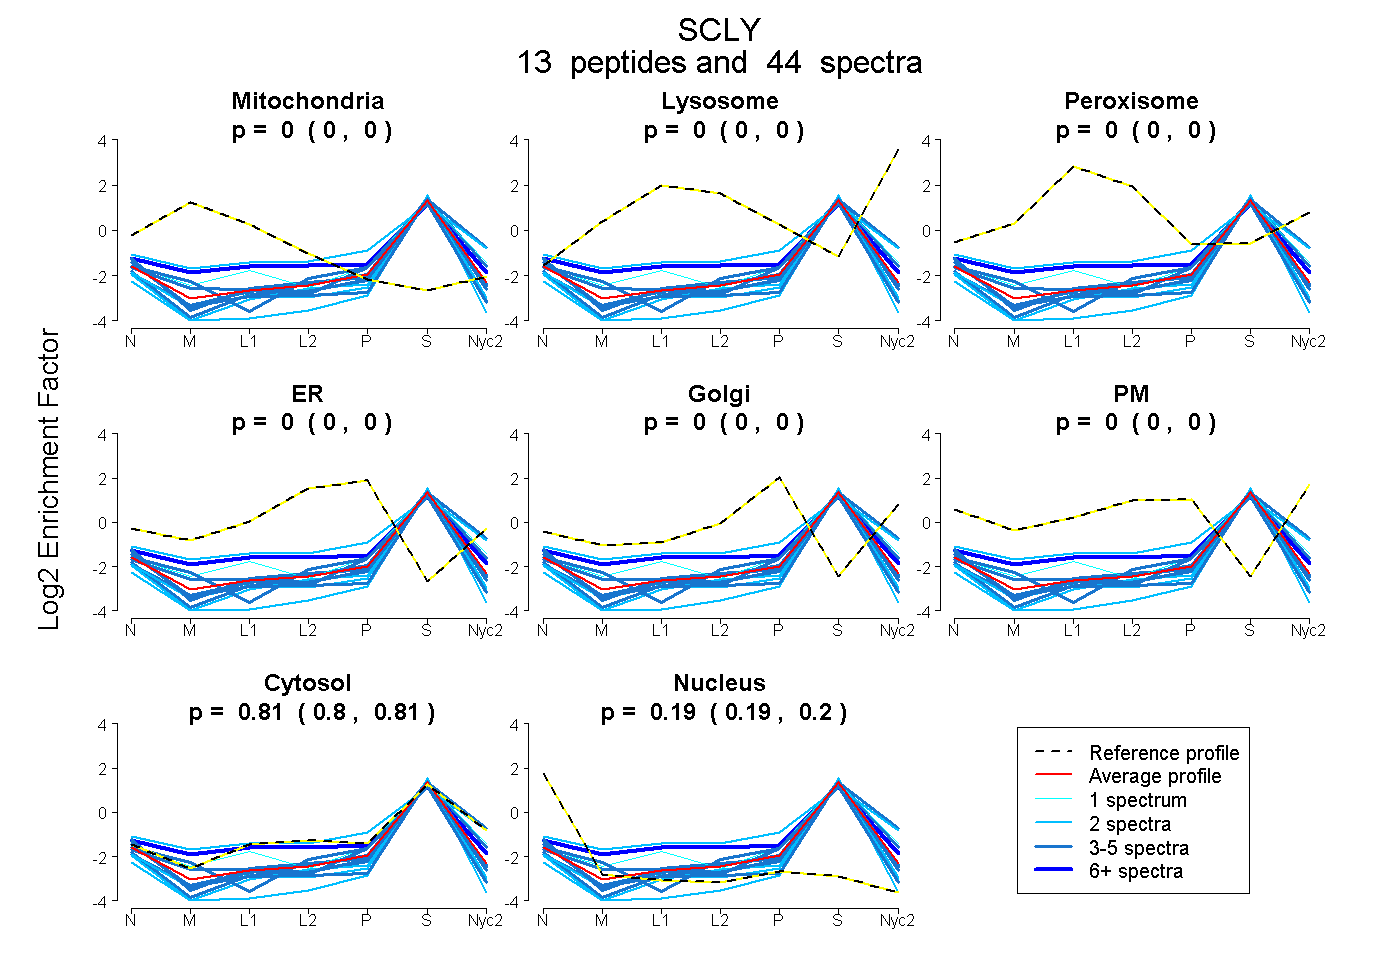
0.000 | 0.000
0.000 | 0.000
0.000 | 0.000
0.000 | 0.000
0.000 | 0.000
0.000 | 0.000
0.802 | 0.813
0.186 | 0.197
12peptides
spectra
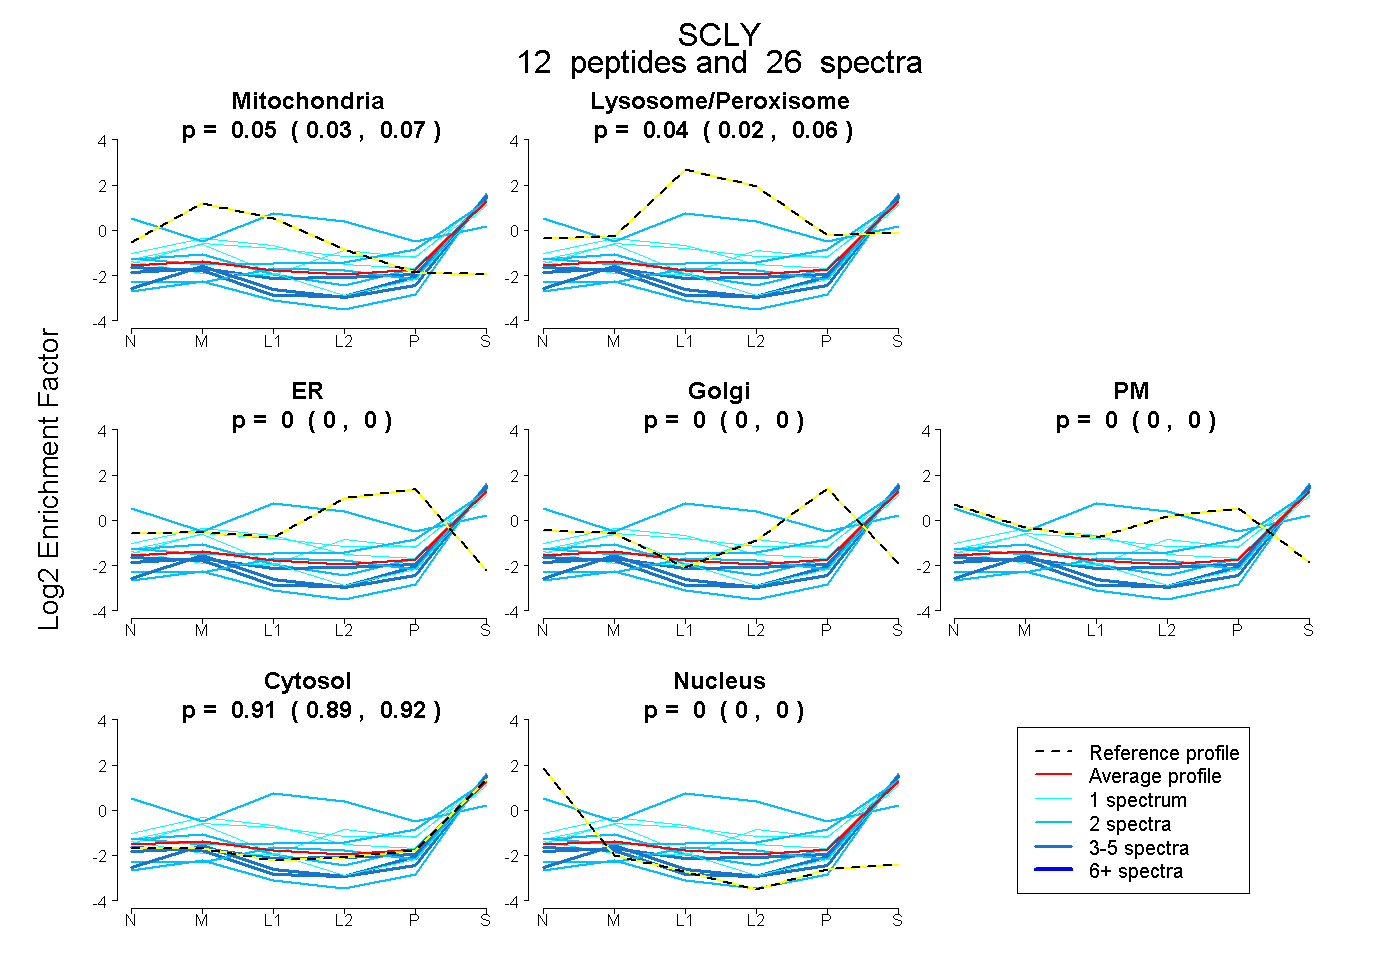
0.028 | 0.065
0.020 | 0.064
0.000 | 0.000
0.000 | 0.000
0.000 | 0.000
0.891 | 0.921
0.000 | 0.004