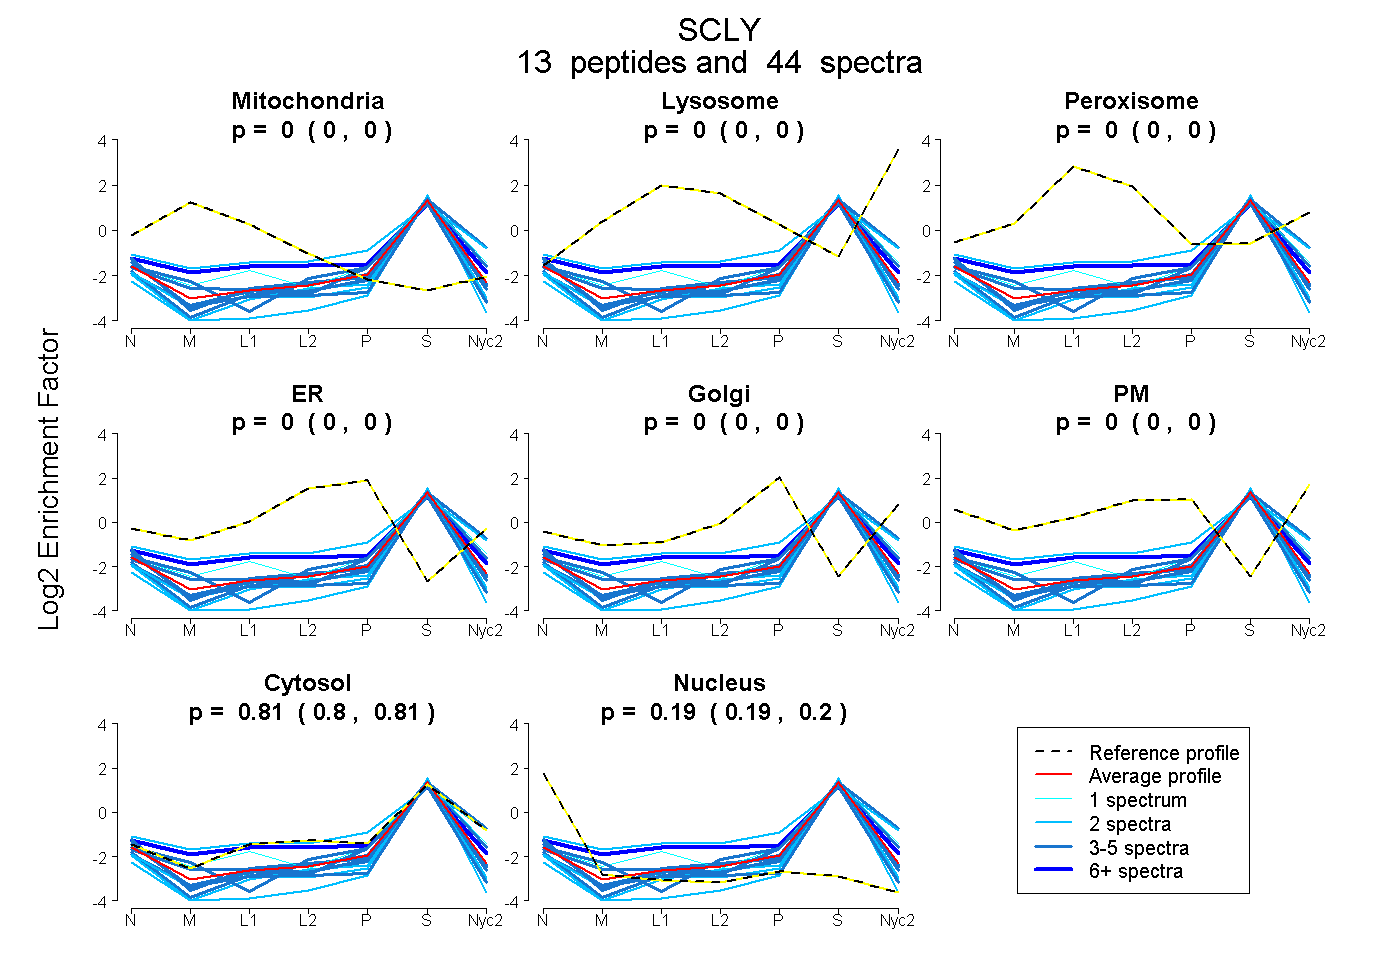
 13
13peptides
spectra
0.000 | 0.000
0.000 | 0.000
0.000 | 0.000
0.000 | 0.000
0.000 | 0.000
0.000 | 0.000
0.802 | 0.813
0.186 | 0.197
| Plot | Mito | Lyso | Perox | ER | Golgi | PM | Cytosol | Nucleus | |||||
| Expt A |
13 peptides |
44 spectra |
|
0.000 0.000 | 0.000 |
0.000 0.000 | 0.000 |
0.000 0.000 | 0.000 |
0.000 0.000 | 0.000 |
0.000 0.000 | 0.000 |
0.000 0.000 | 0.000 |
0.808 0.802 | 0.813 |
0.192 0.186 | 0.197 |
| 1 spectrum, LPNTCNFSIQGSQLR | 0.000 | 0.000 | 0.000 | 0.000 | 0.000 | 0.000 | 0.909 | 0.091 | ||
| 3 spectra, AEVDLIVQDLK | 0.000 | 0.000 | 0.000 | 0.000 | 0.000 | 0.000 | 0.730 | 0.270 | ||
| 5 spectra, LEAEFGK | 0.000 | 0.000 | 0.000 | 0.000 | 0.000 | 0.000 | 0.788 | 0.212 | ||
| 3 spectra, LTPLYPMLFGGGQER | 0.000 | 0.000 | 0.000 | 0.000 | 0.000 | 0.000 | 0.727 | 0.273 | ||
| 3 spectra, VLVHTDAAQALGK | 0.000 | 0.000 | 0.000 | 0.000 | 0.000 | 0.000 | 0.725 | 0.275 | ||
| 2 spectra, GSVESPPNR | 0.000 | 0.000 | 0.000 | 0.000 | 0.000 | 0.000 | 0.768 | 0.232 | ||
| 11 spectra, AADLVSENCETYEAHMR | 0.072 | 0.000 | 0.000 | 0.000 | 0.000 | 0.000 | 0.856 | 0.071 | ||
| 2 spectra, EAWGNPSSSYVAGR | 0.000 | 0.000 | 0.000 | 0.000 | 0.000 | 0.000 | 0.658 | 0.342 | ||
| 3 spectra, ALGGQLR | 0.000 | 0.000 | 0.000 | 0.000 | 0.000 | 0.000 | 0.882 | 0.118 | ||
| 4 spectra, DIINTAR | 0.000 | 0.000 | 0.000 | 0.000 | 0.000 | 0.000 | 0.800 | 0.200 | ||
| 2 spectra, FPGVER | 0.000 | 0.000 | 0.000 | 0.000 | 0.000 | 0.000 | 0.741 | 0.259 | ||
| 3 spectra, IGALYVR | 0.000 | 0.000 | 0.000 | 0.000 | 0.000 | 0.000 | 0.881 | 0.119 | ||
| 2 spectra, QAVNQLEGPV | 0.066 | 0.000 | 0.000 | 0.000 | 0.076 | 0.000 | 0.858 | 0.000 |
| Plot | Mito | Lyso or Perox | ER | Golgi | PM | Cytosol | Nucleus | ||||||
| Expt B |
12 peptides |
26 spectra |
 |
0.049 0.028 | 0.065 |
0.043 0.020 | 0.064 |
0.000 0.000 | 0.000 |
0.000 0.000 | 0.000 |
0.000 0.000 | 0.000 |
0.908 0.891 | 0.921 |
0.000 0.000 | 0.004 |
|||
| Plot | Lyso | Other | |||||||||||
| Expt C |
8 peptides |
22 spectra |
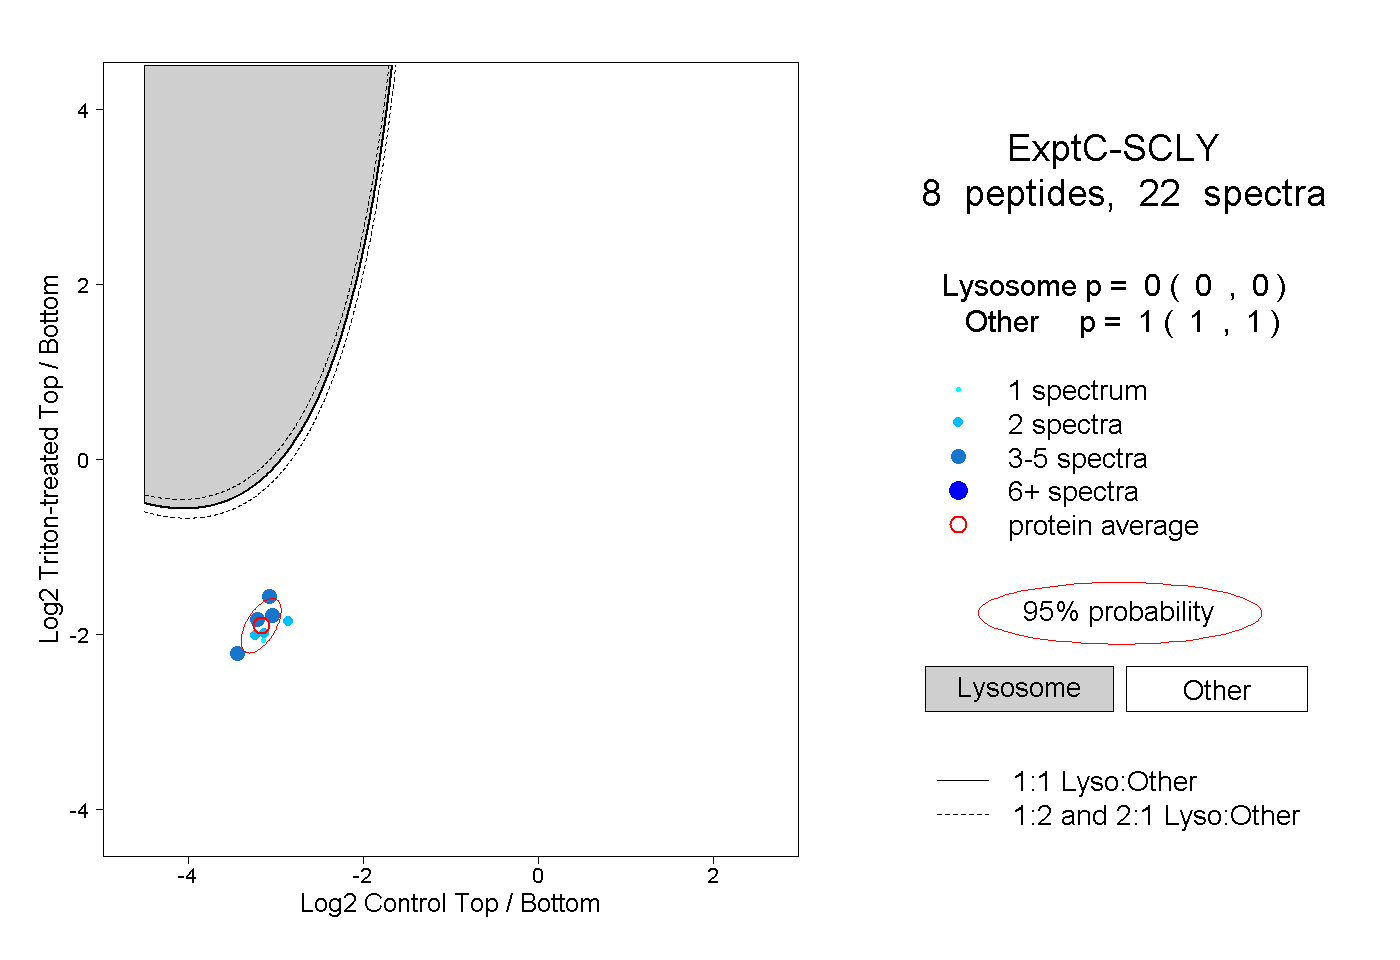 |
0.000 0.000 | 0.000 |
1.000 1.000 | 1.000 |
||||||||
| Plot | Lyso | Other | |||||||||||
| Expt D |
1 peptide |
2 spectra |
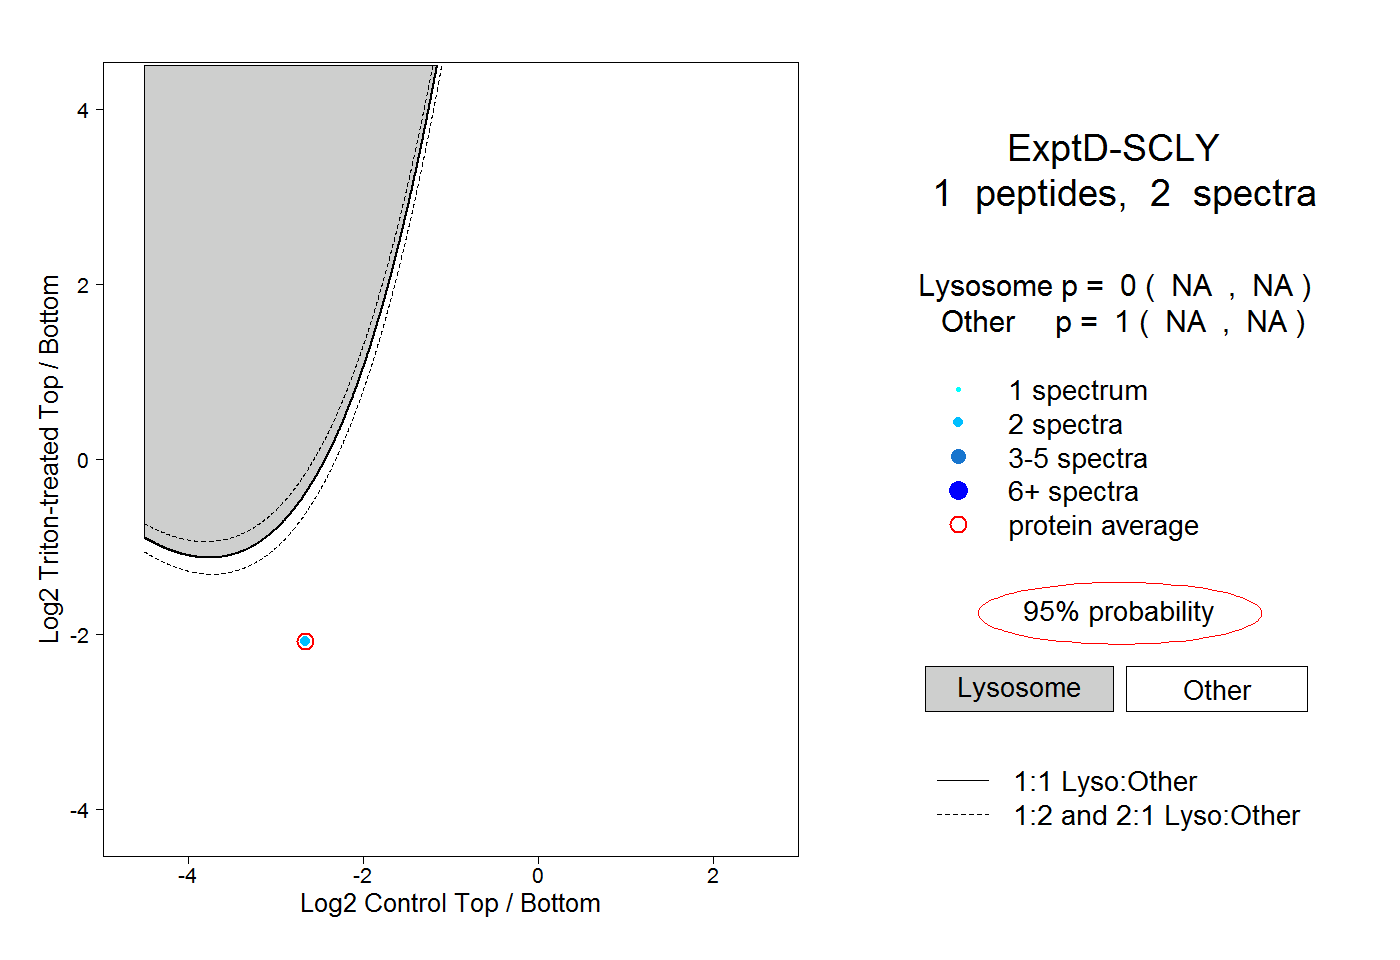 |
0.000 NA | NA |
1.000 NA | NA |