 7
7peptides
spectra
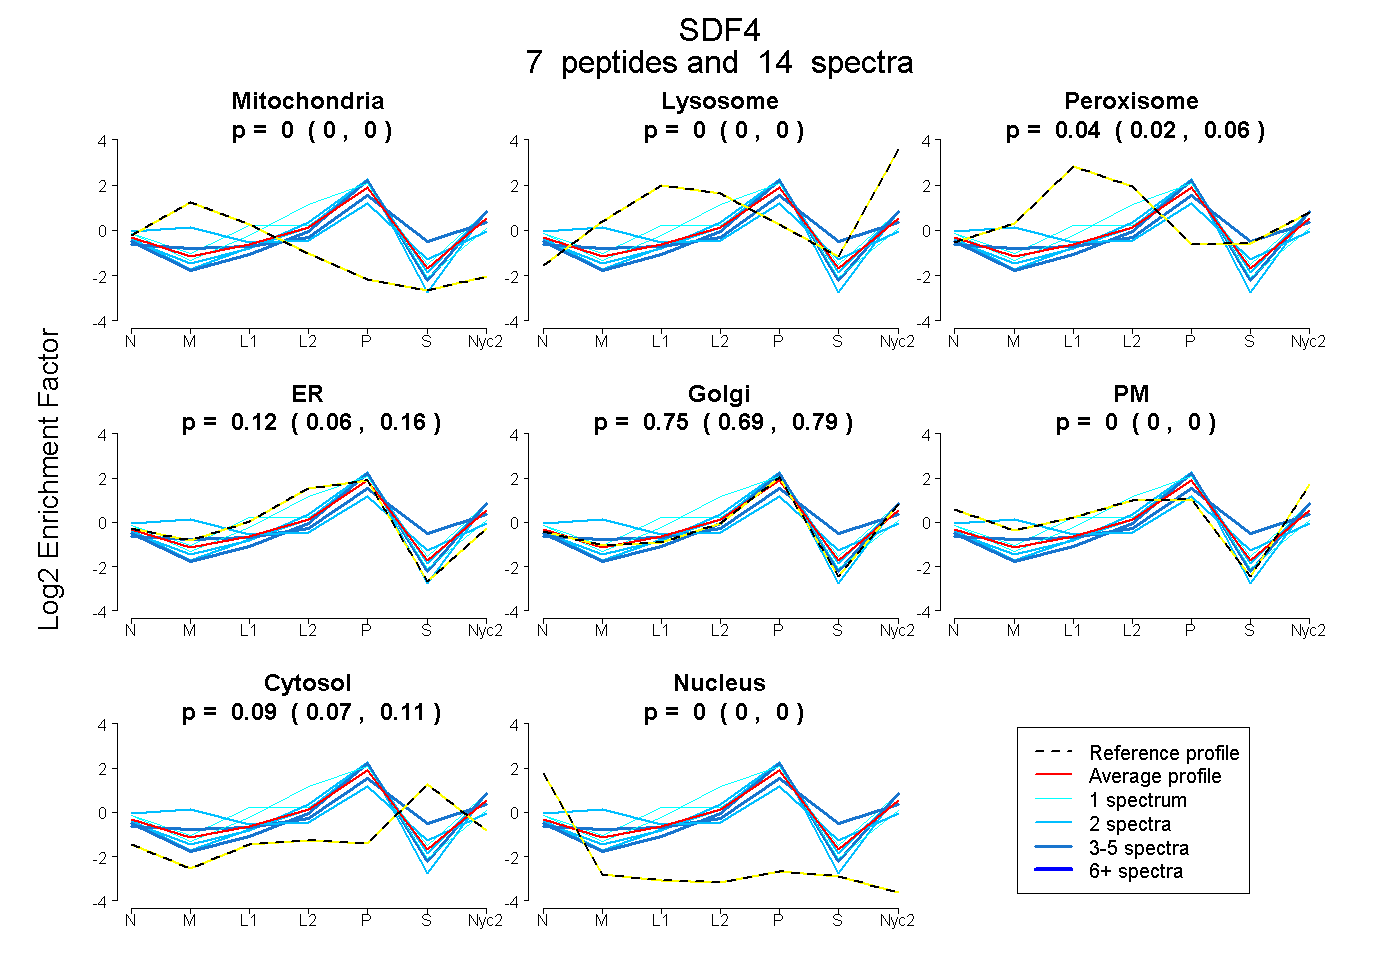
0.000 | 0.000
0.000 | 0.000
0.017 | 0.060
0.062 | 0.165
0.691 | 0.787
0.000 | 0.000
0.071 | 0.114
0.000 | 0.000
3peptides
spectra
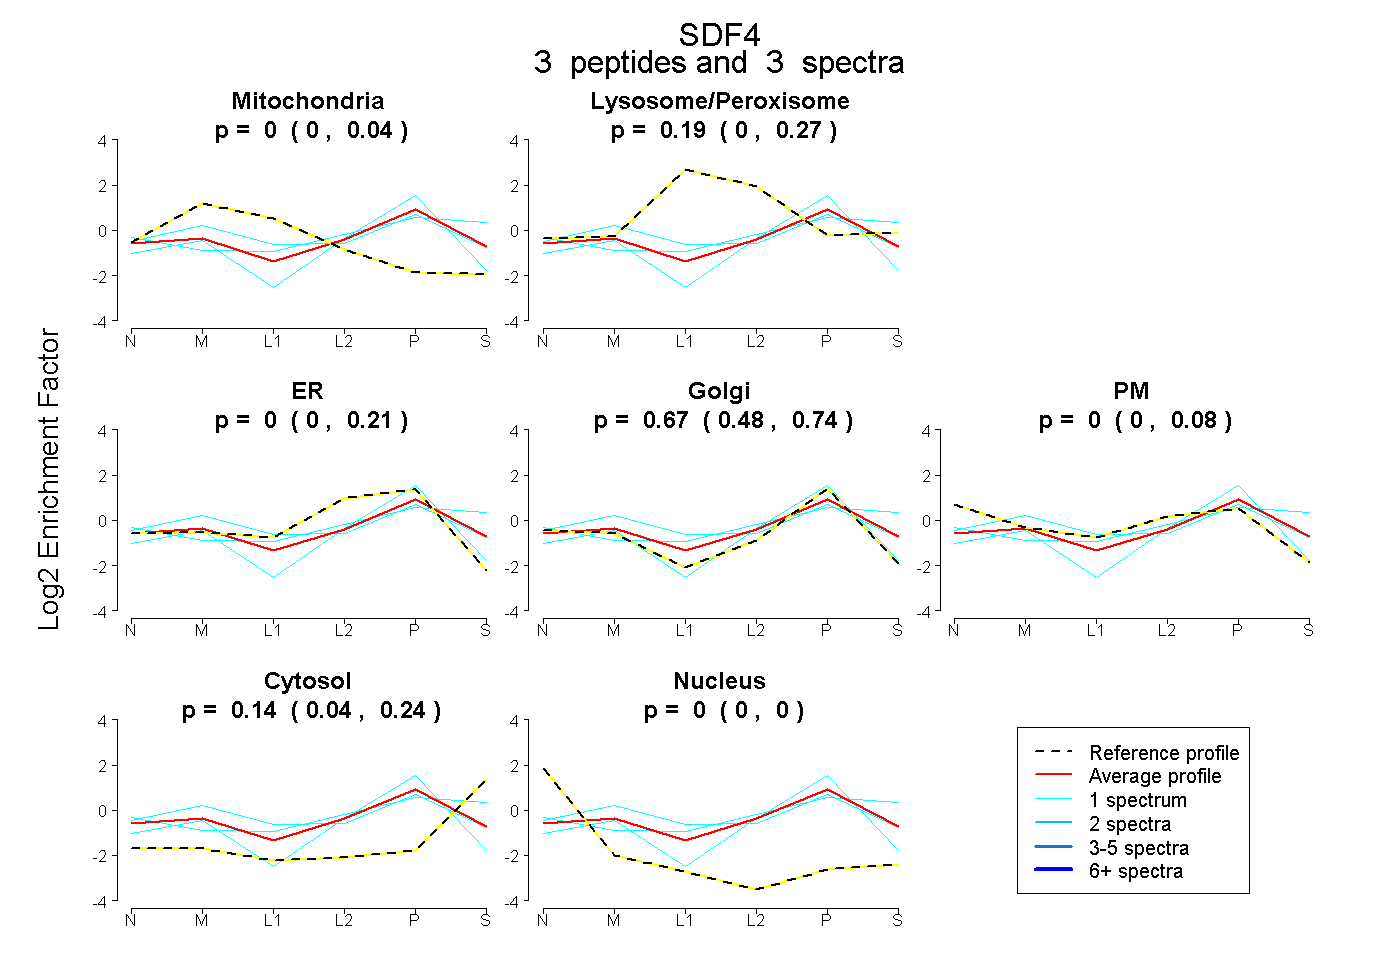
0.000 | 0.044
0.000 | 0.265
0.000 | 0.210
0.482 | 0.739
0.000 | 0.078
0.035 | 0.238
0.000 | 0.000
6peptides
spectra
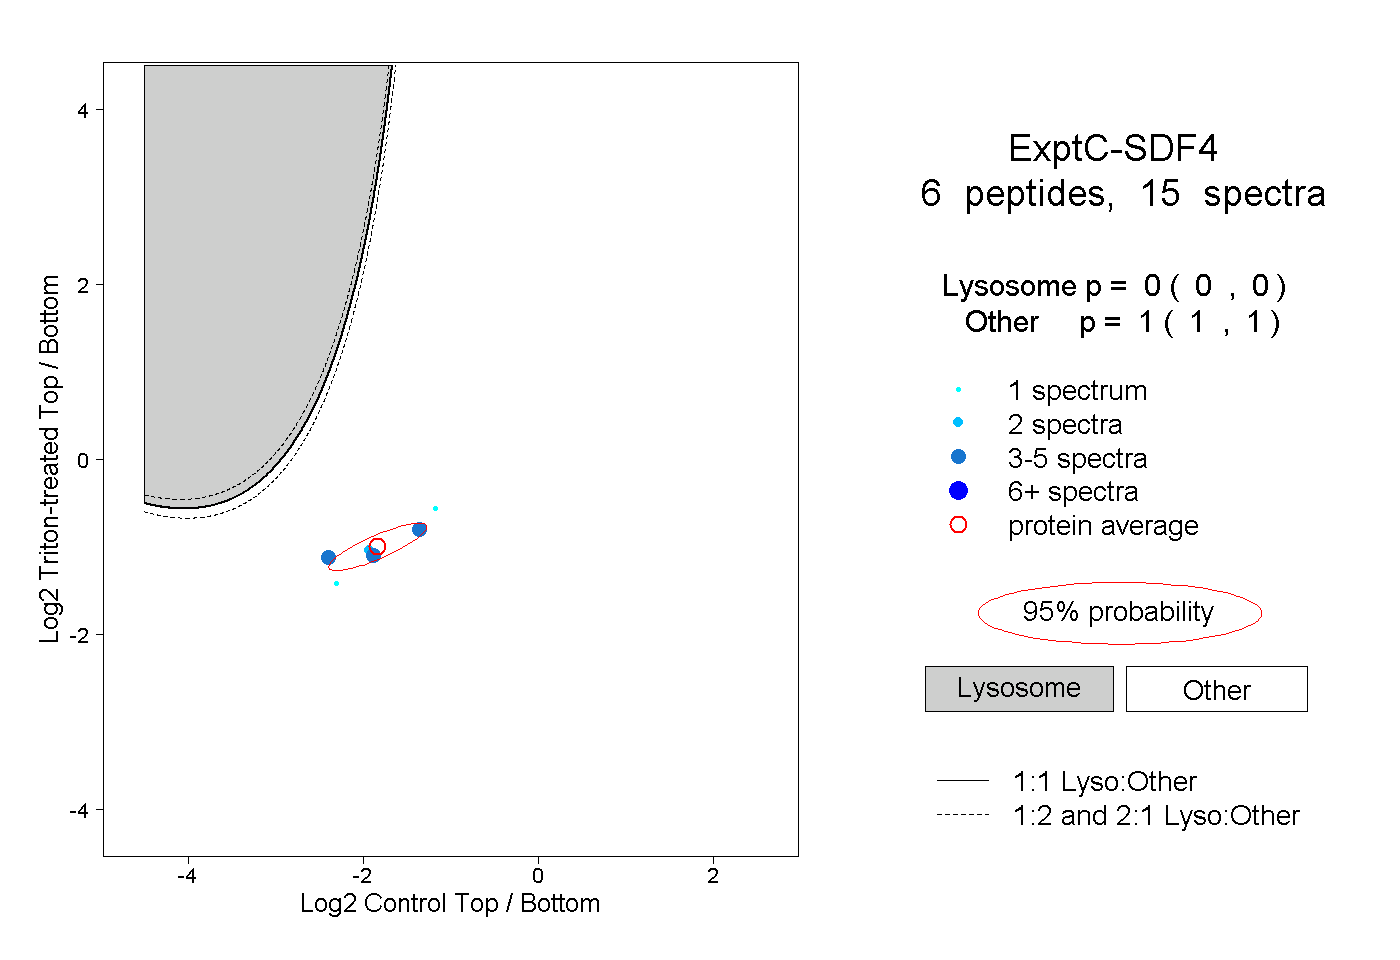
0.000 | 0.000
1.000 | 1.000
1peptide
spectrum
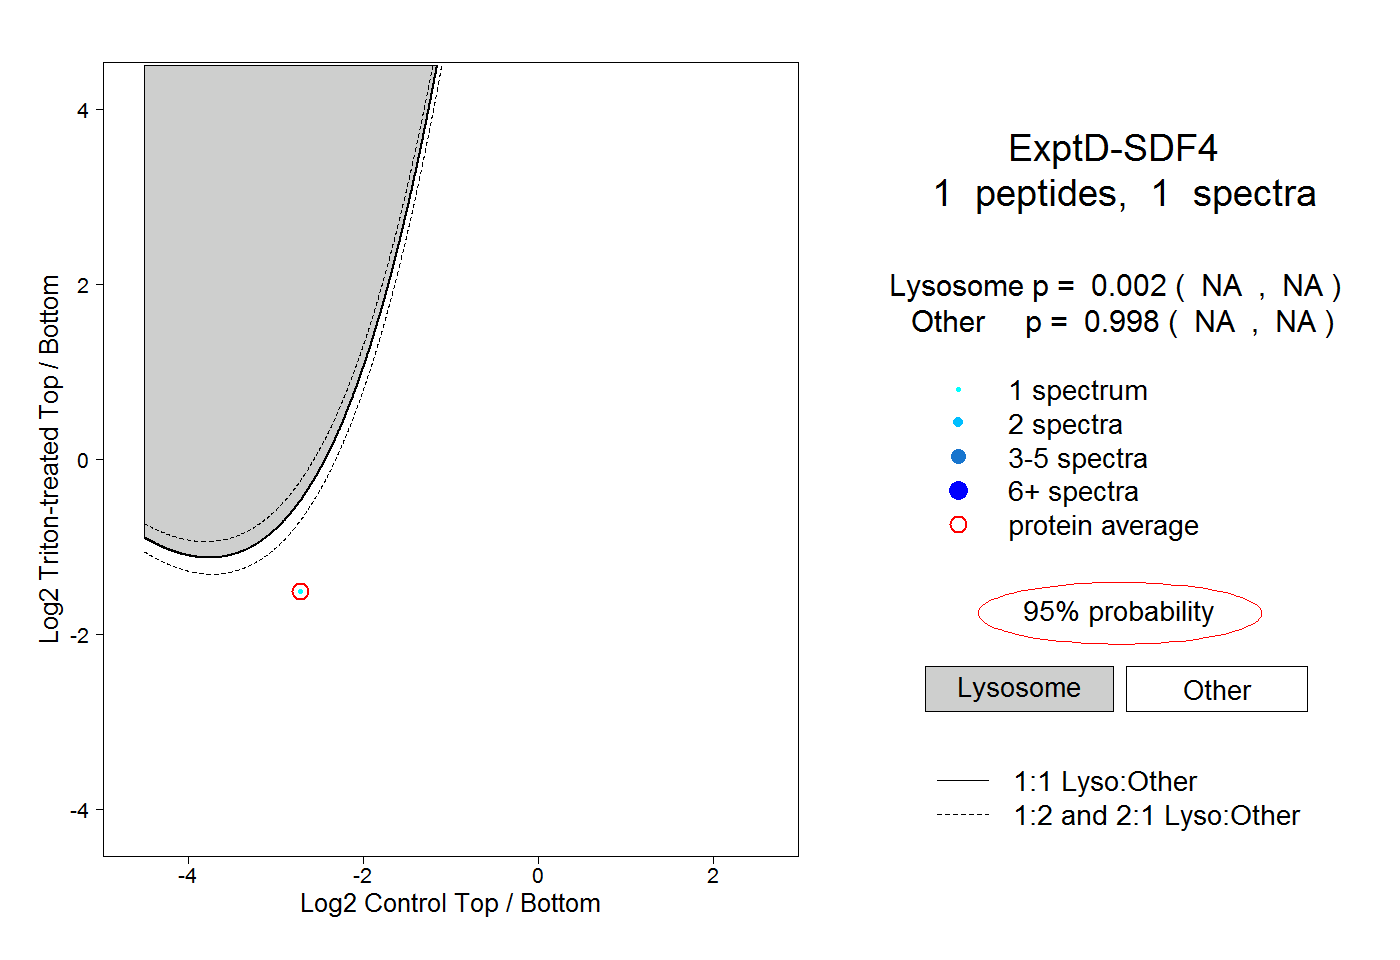
NA | NA
NA | NA