 2
2peptides
spectra
NA | NA
NA | NA
NA | NA
NA | NA
NA | NA
NA | NA
NA | NA
NA | NA
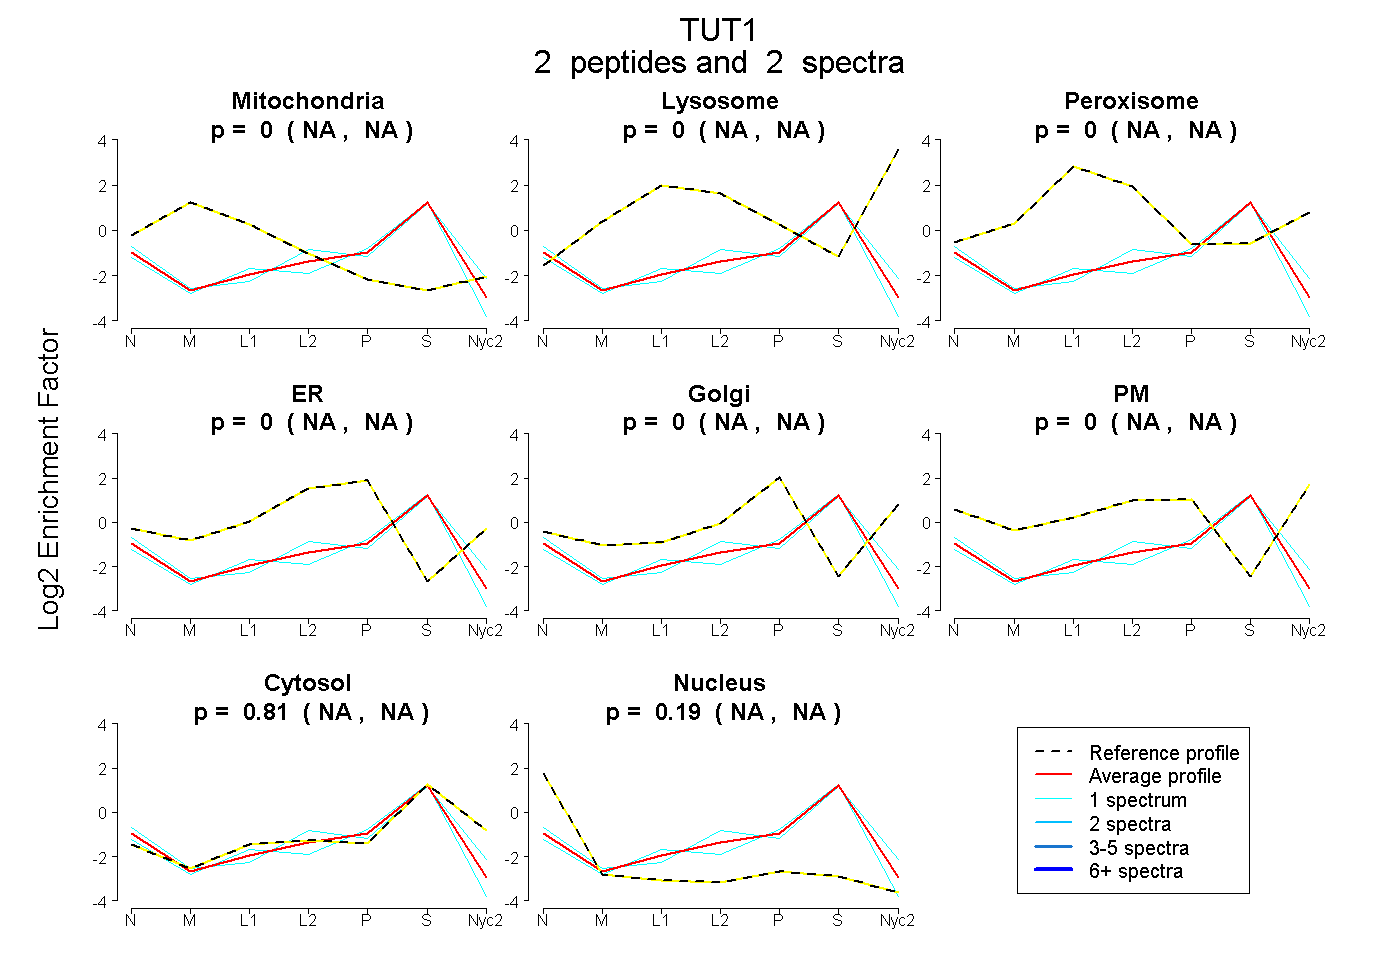
| Plot | Mito | Lyso | Perox | ER | Golgi | PM | Cytosol | Nucleus | |||||
| Expt A |
2 peptides |
2 spectra |
|
0.000 NA | NA |
0.000 NA | NA |
0.000 NA | NA |
0.000 NA | NA |
0.000 NA | NA |
0.000 NA | NA |
0.810 NA | NA |
0.190 NA | NA |
| 1 spectrum, VRPLVYTLR | 0.000 | 0.000 | 0.000 | 0.000 | 0.000 | 0.000 | 0.770 | 0.230 | ||
| 1 spectrum, VQTVPSAR | 0.000 | 0.000 | 0.000 | 0.007 | 0.000 | 0.000 | 0.844 | 0.149 |