 8
8peptides
spectra
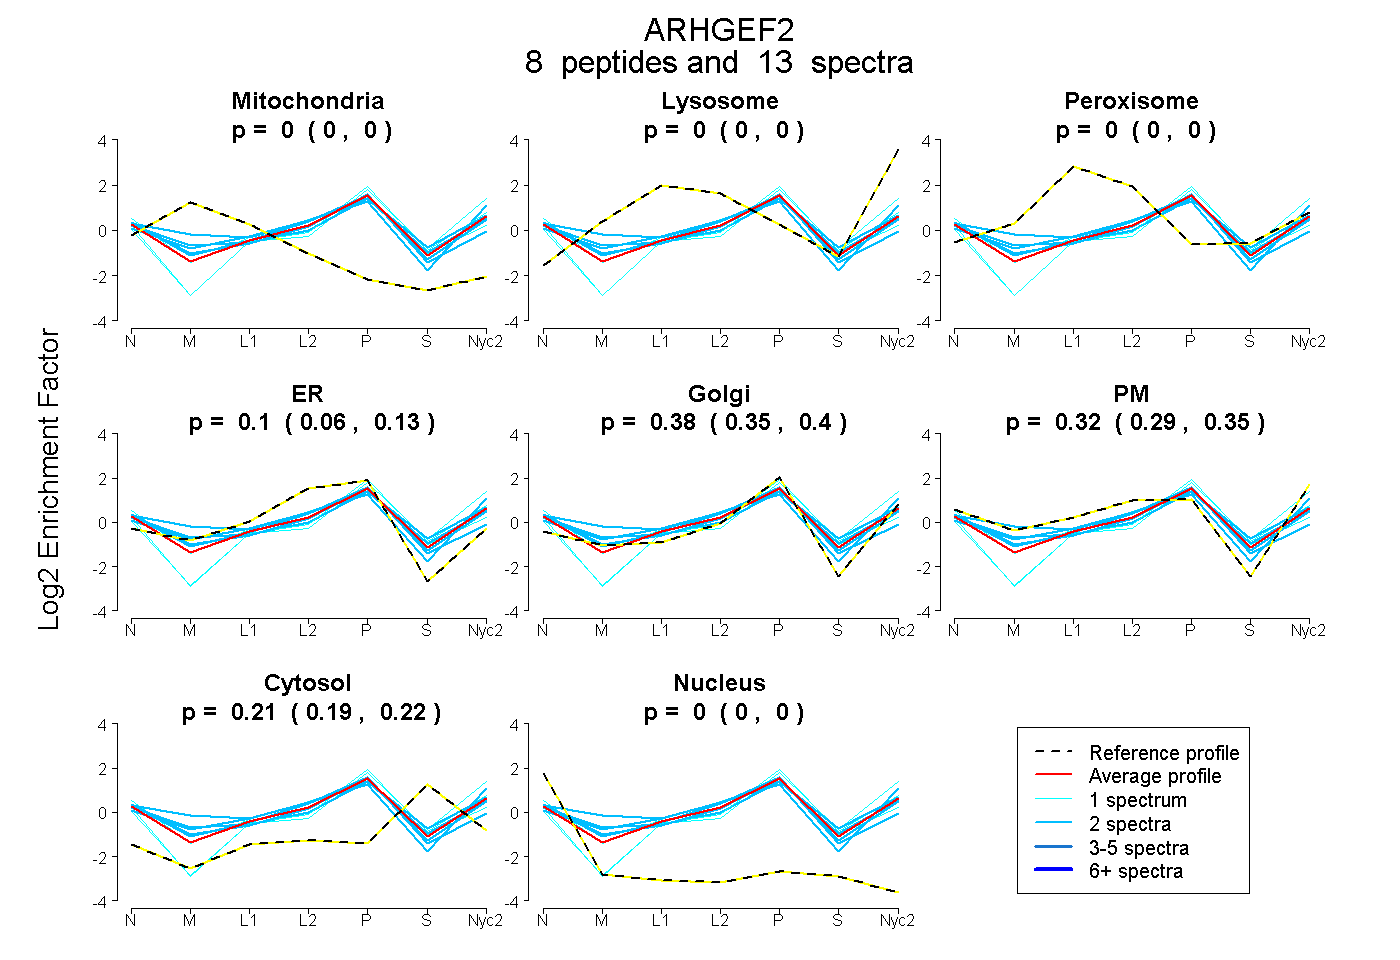
0.000 | 0.000
0.000 | 0.000
0.000 | 0.000
0.058 | 0.129
0.346 | 0.402
0.285 | 0.350
0.195 | 0.218
0.000 | 0.000
| Plot | Mito | Lyso | Perox | ER | Golgi | PM | Cytosol | Nucleus | |||||
| Expt A |
8 peptides |
13 spectra |
|
0.000 0.000 | 0.000 |
0.000 0.000 | 0.000 |
0.000 0.000 | 0.000 |
0.097 0.058 | 0.129 |
0.376 0.346 | 0.402 |
0.320 0.285 | 0.350 |
0.207 0.195 | 0.218 |
0.000 0.000 | 0.000 |
| 2 spectra, NFVIHR | 0.000 | 0.000 | 0.137 | 0.042 | 0.399 | 0.241 | 0.181 | 0.000 | ||
| 1 spectrum, MQDIPEETESR | 0.000 | 0.000 | 0.000 | 0.000 | 0.716 | 0.033 | 0.252 | 0.000 | ||
| 2 spectra, FQQFIR | 0.033 | 0.000 | 0.030 | 0.000 | 0.293 | 0.582 | 0.062 | 0.000 | ||
| 2 spectra, QALCPGSTR | 0.000 | 0.000 | 0.000 | 0.327 | 0.336 | 0.141 | 0.157 | 0.040 | ||
| 1 spectrum, EAQELGSPEDR | 0.000 | 0.000 | 0.000 | 0.000 | 0.597 | 0.153 | 0.251 | 0.000 | ||
| 2 spectra, VIQQSVR | 0.000 | 0.000 | 0.000 | 0.201 | 0.299 | 0.322 | 0.178 | 0.000 | ||
| 2 spectra, LESFESLR | 0.000 | 0.000 | 0.048 | 0.000 | 0.455 | 0.293 | 0.204 | 0.000 | ||
| 1 spectrum, AGFIGMPPPTLPR | 0.000 | 0.000 | 0.000 | 0.326 | 0.101 | 0.324 | 0.249 | 0.000 |
| Plot | Lyso | Other | |||||||||||
| Expt C |
3 peptides |
6 spectra |
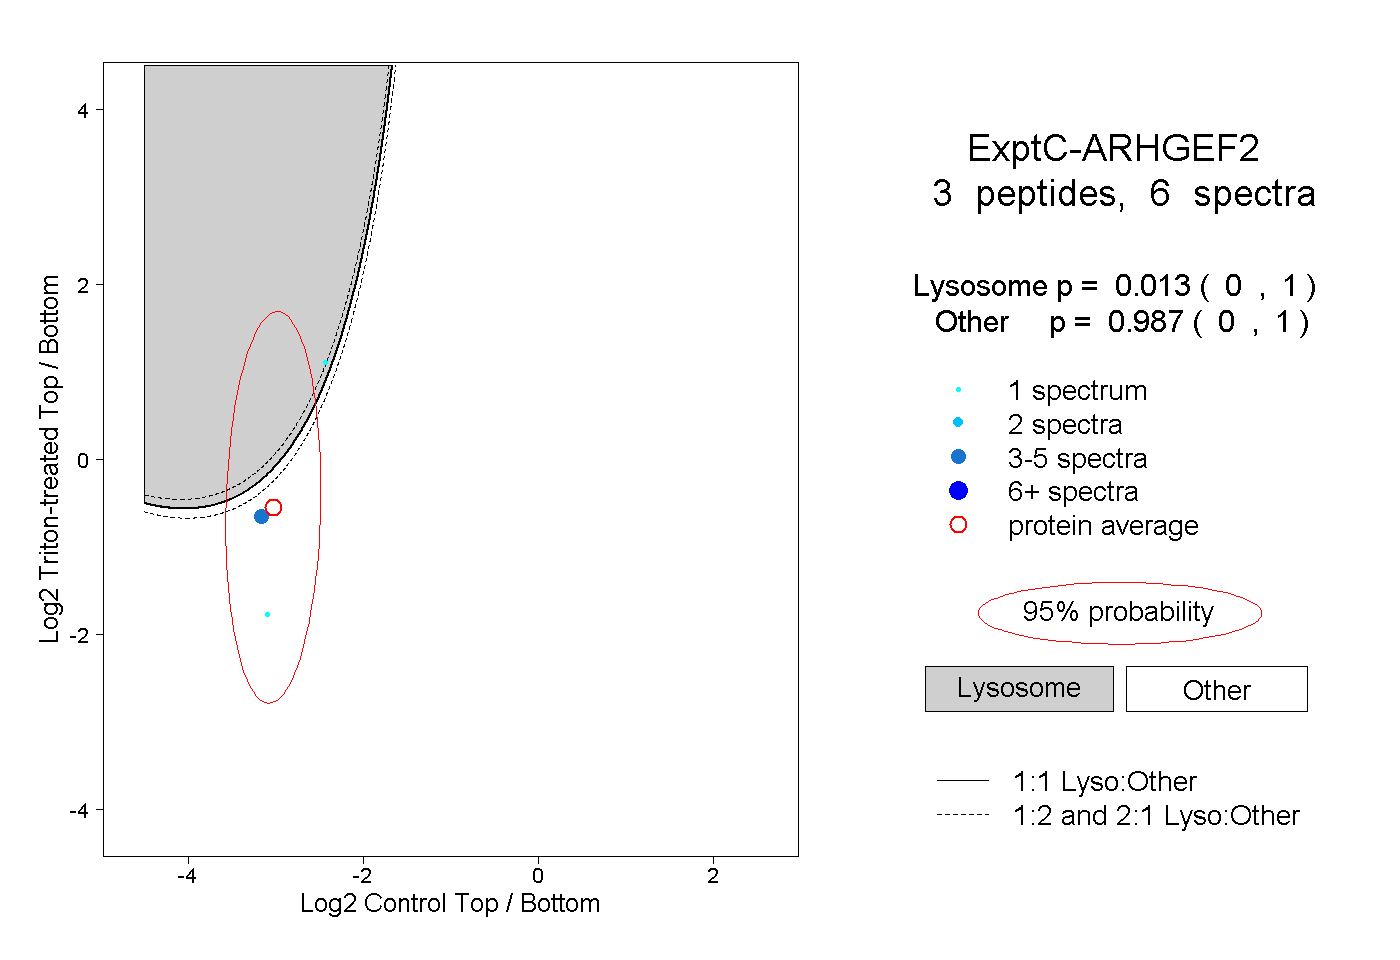 |
0.013 0.000 | 1.000 |
0.987 0.000 | 1.000 |
||||||||
| Plot | Lyso | Other | |||||||||||
| Expt D |
1 peptide |
2 spectra |
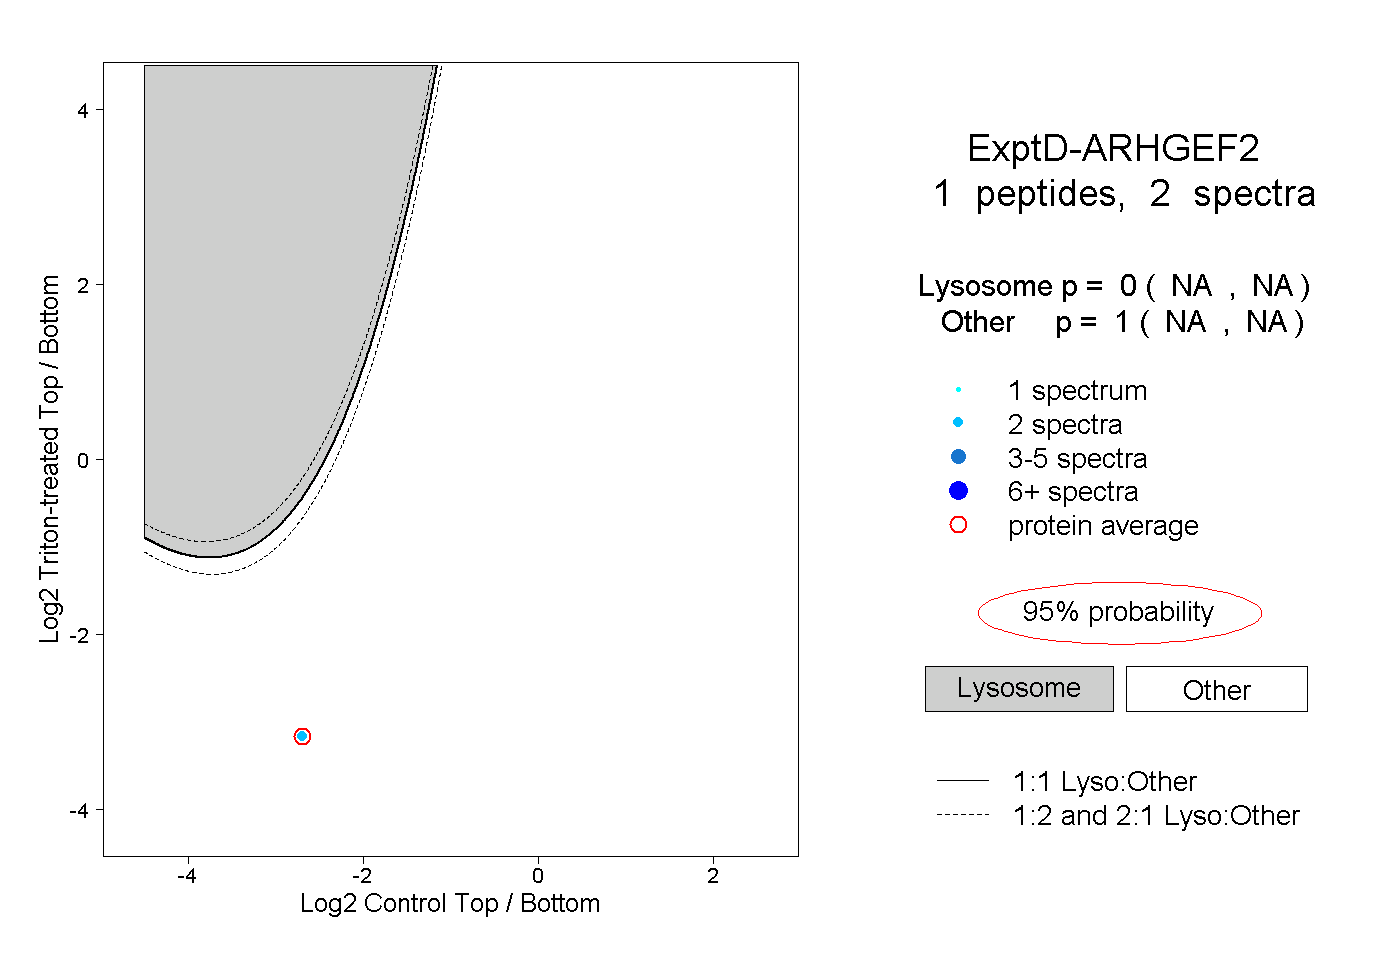 |
0.000 NA | NA |
1.000 NA | NA |