 2
2peptides
spectra
NA | NA
NA | NA
NA | NA
NA | NA
NA | NA
NA | NA
NA | NA
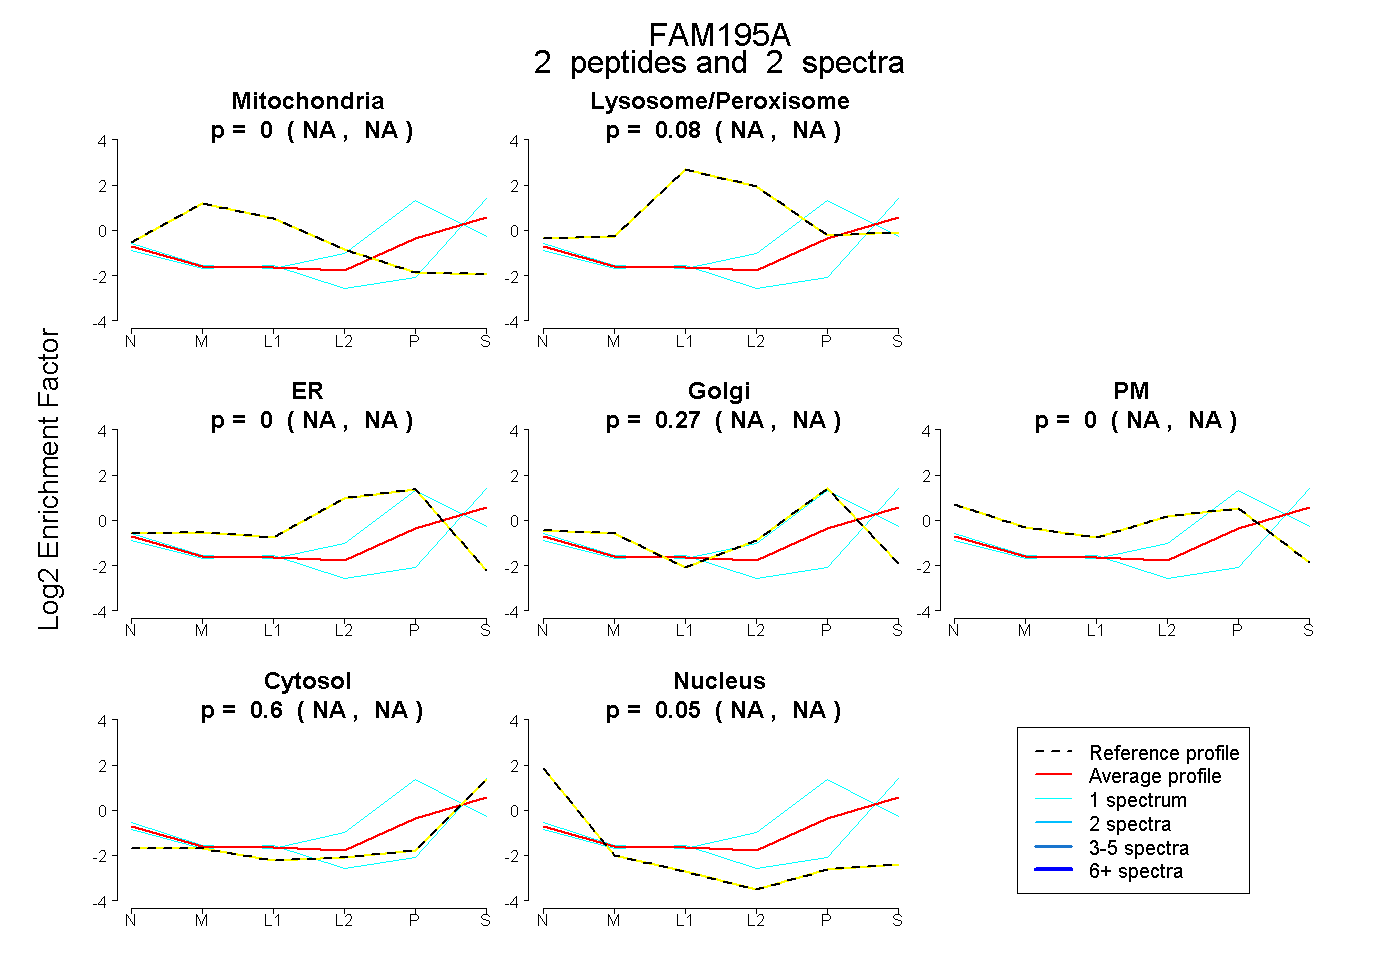
| Plot | Mito | Lyso or Perox | ER | Golgi | PM | Cytosol | Nucleus | ||||||
| Expt B |
2 peptides |
2 spectra |
|
0.000 NA | NA |
0.078 NA | NA |
0.000 NA | NA |
0.273 NA | NA |
0.000 NA | NA |
0.604 NA | NA |
0.045 NA | NA |
| 1 spectrum, LGELLK | 0.000 | 0.037 | 0.000 | 0.000 | 0.000 | 0.846 | 0.118 | |||
| 1 spectrum, TGATQQQVESR | 0.000 | 0.071 | 0.000 | 0.674 | 0.000 | 0.254 | 0.000 |
| Plot | Lyso | Other | |||||||||||
| Expt C |
1 peptide |
2 spectra |
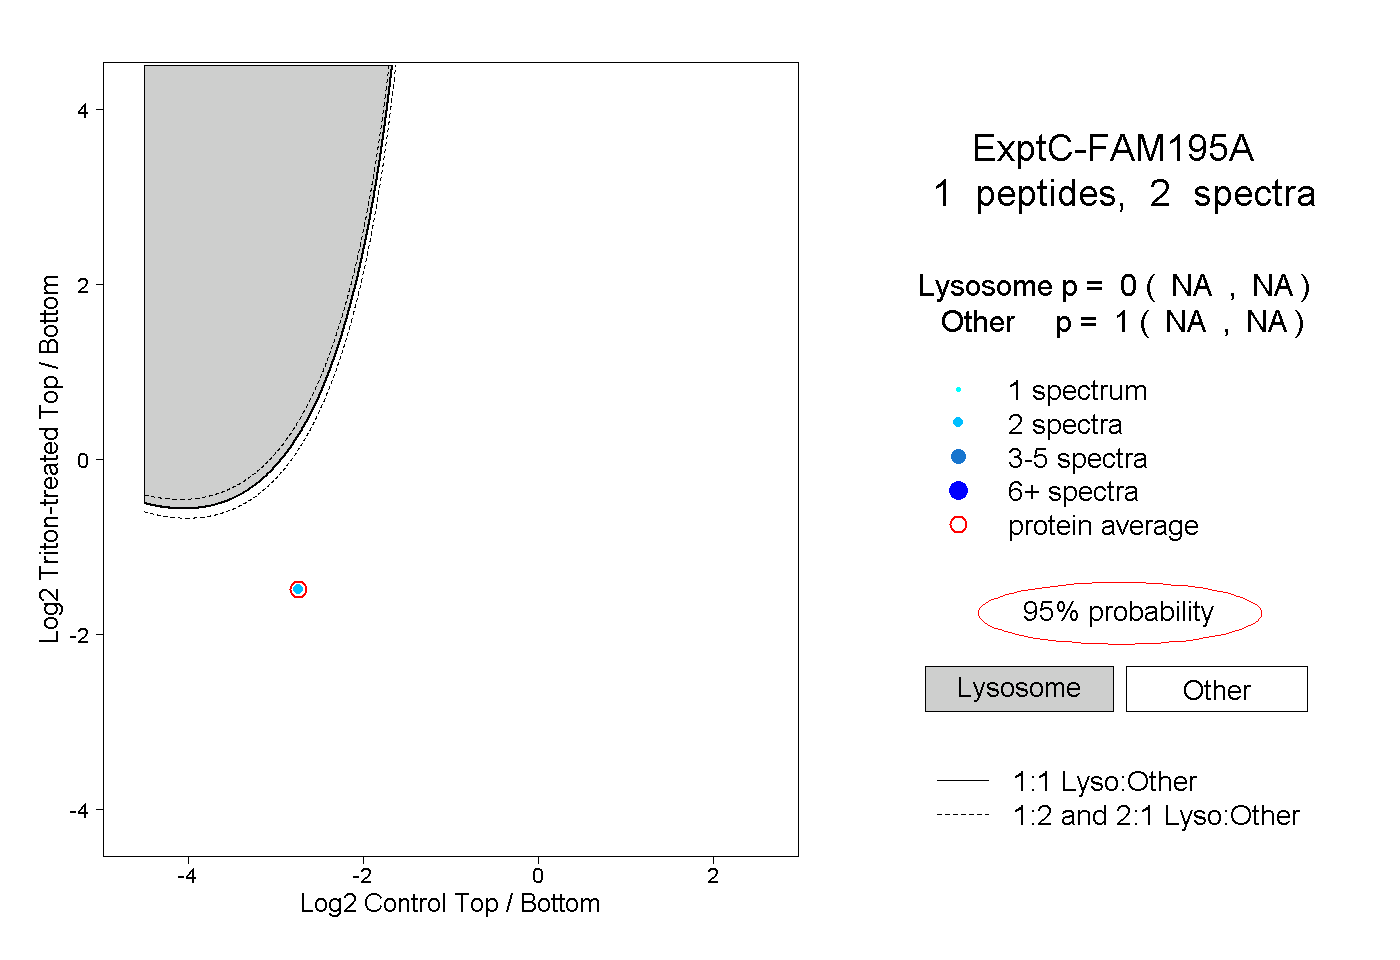 |
0.000 NA | NA |
1.000 NA | NA |