15
15peptides
spectra
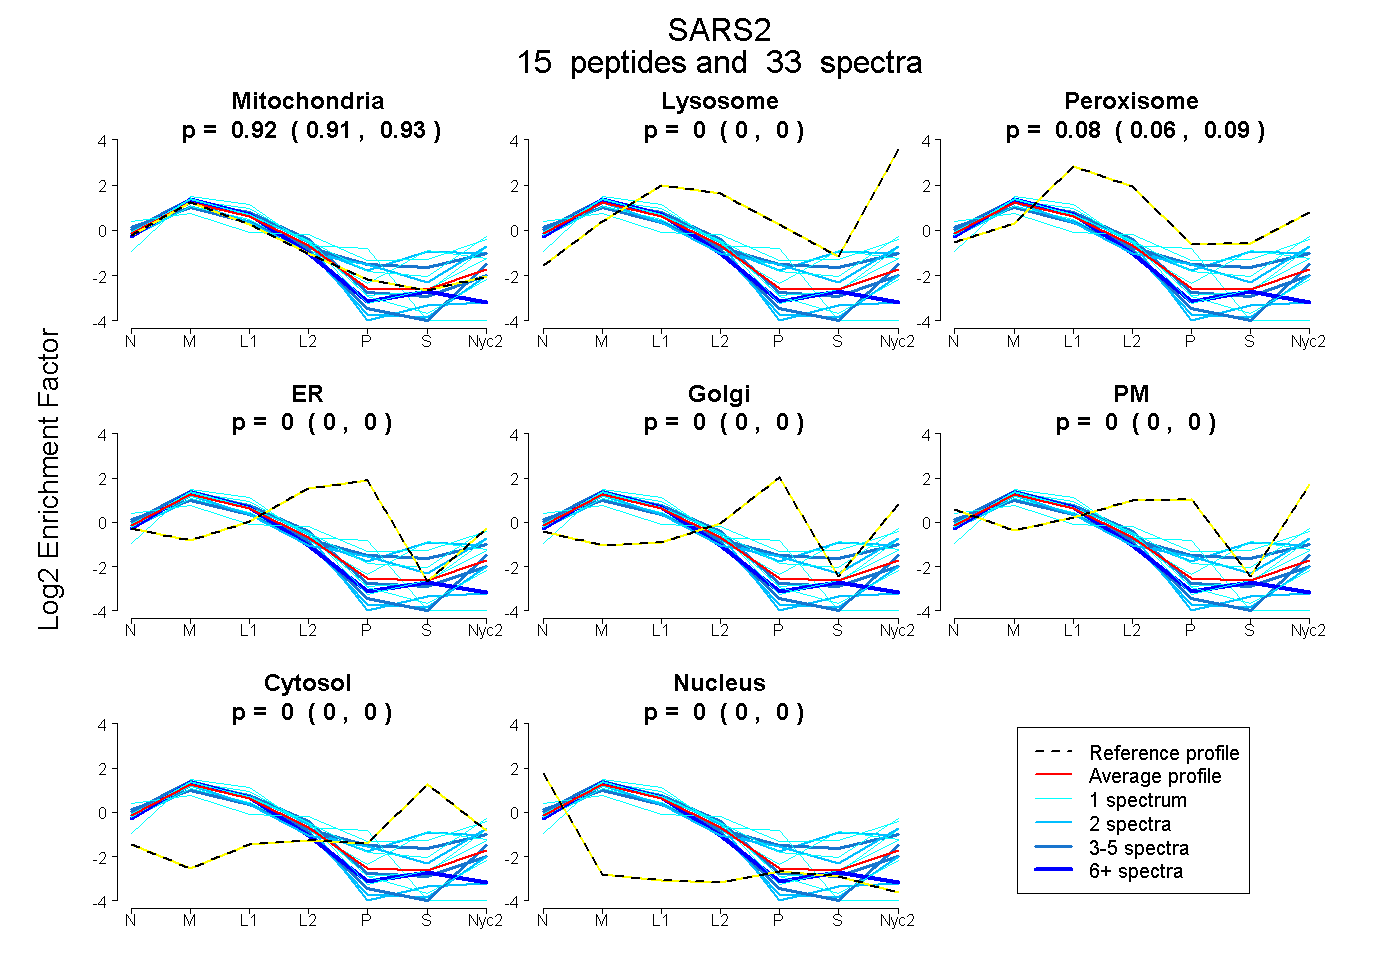
0.912 | 0.934
0.000 | 0.000
0.064 | 0.086
0.000 | 0.000
0.000 | 0.000
0.000 | 0.000
0.000 | 0.000
0.000 | 0.000
7peptides
spectra
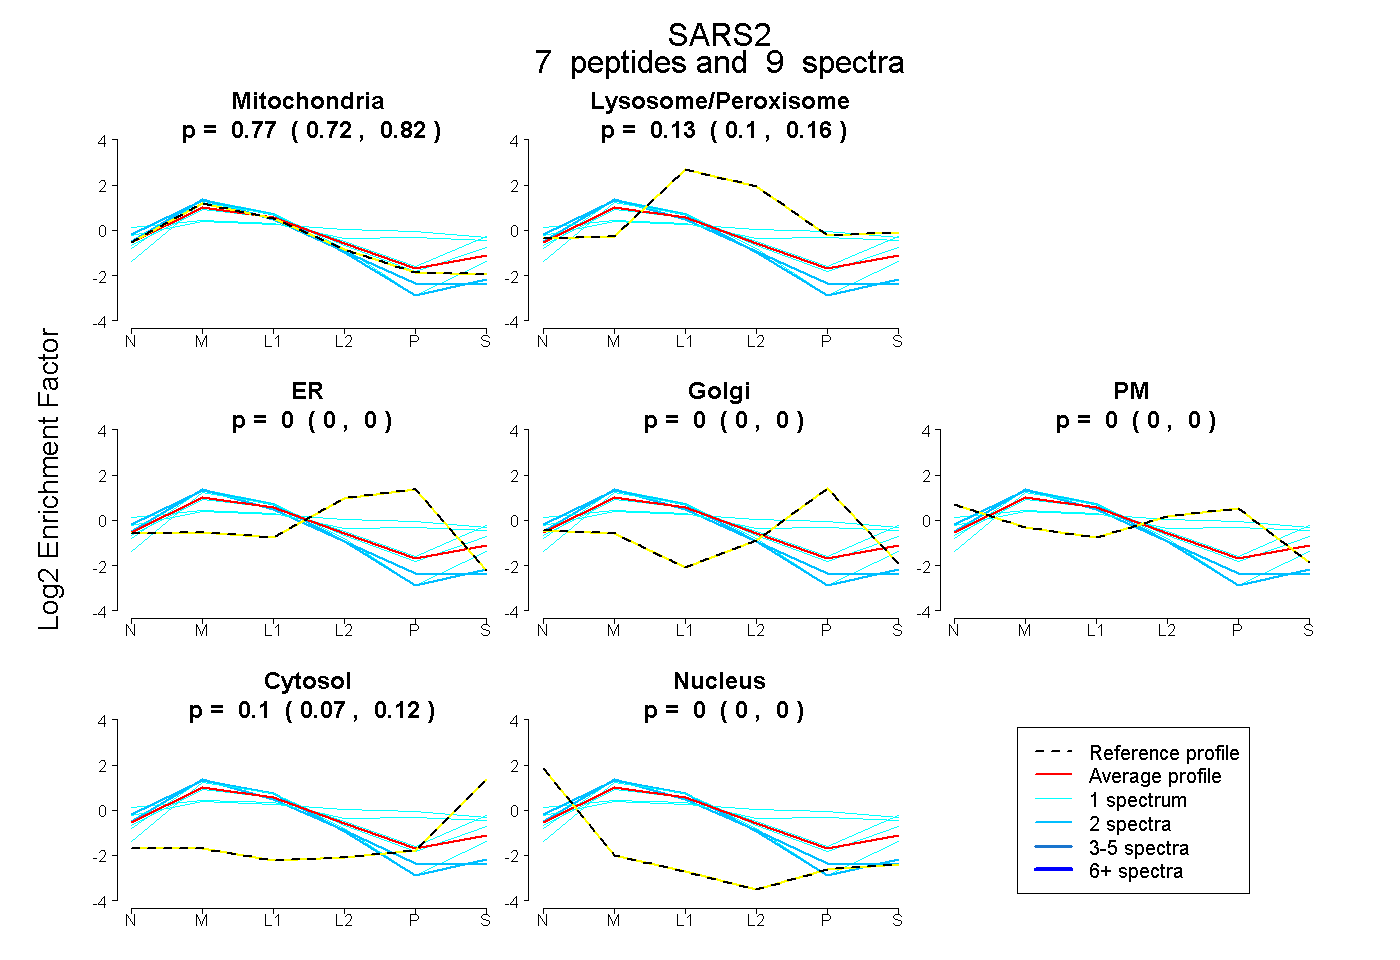
0.719 | 0.817
0.097 | 0.157
0.000 | 0.000
0.000 | 0.000
0.000 | 0.000
0.070 | 0.119
0.000 | 0.000