 15
15peptides
spectra
0.912 | 0.934
0.000 | 0.000
0.064 | 0.086
0.000 | 0.000
0.000 | 0.000
0.000 | 0.000
0.000 | 0.000
0.000 | 0.000
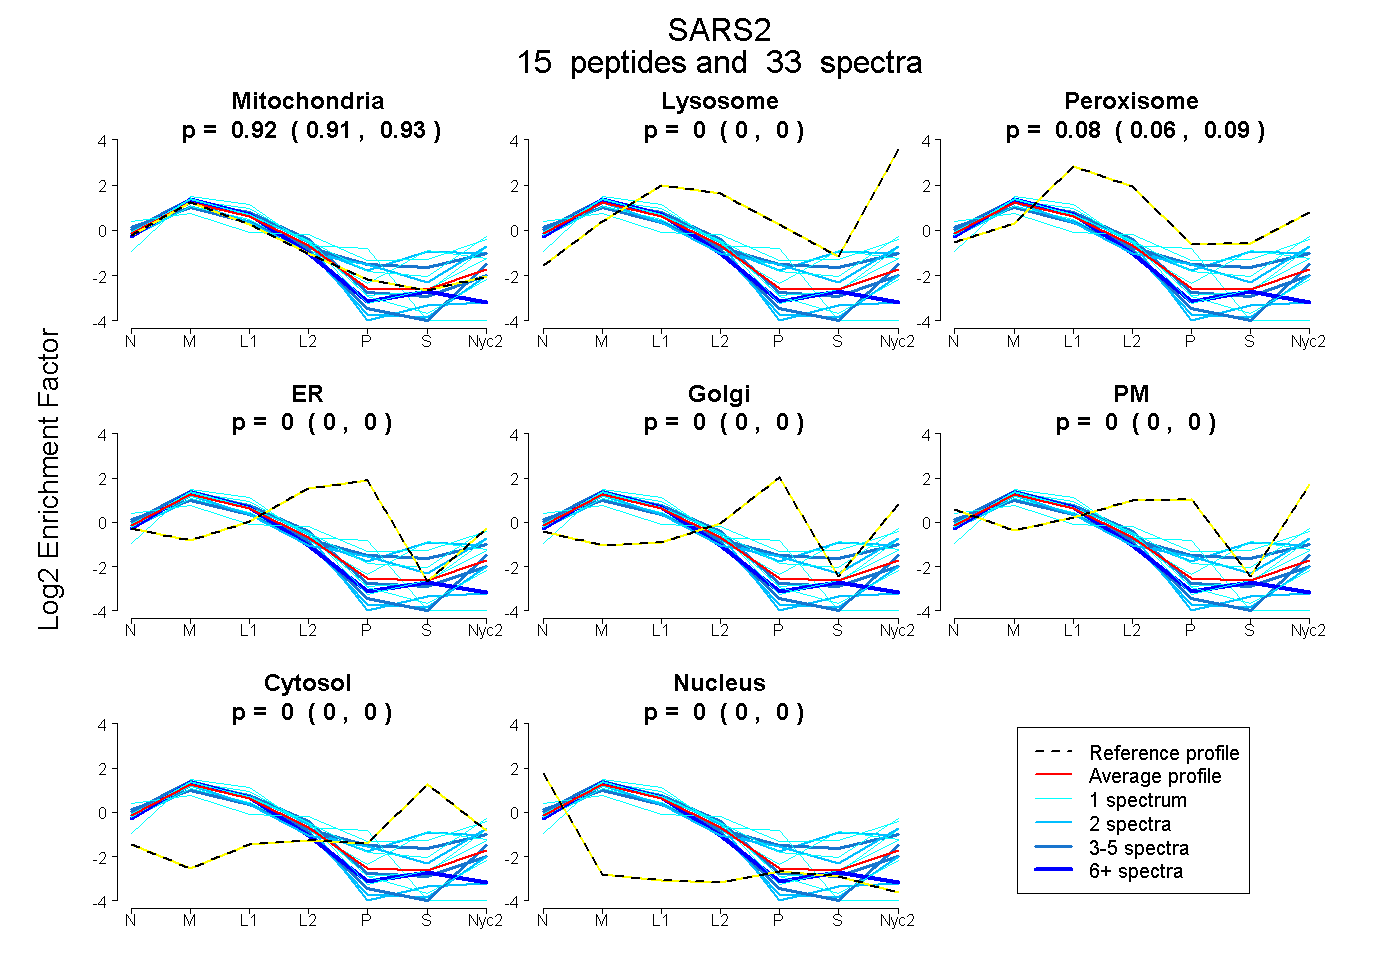
| Plot | Mito | Lyso | Perox | ER | Golgi | PM | Cytosol | Nucleus | |||||
| Expt A |
15 peptides |
33 spectra |
|
0.924 0.912 | 0.934 |
0.000 0.000 | 0.000 |
0.076 0.064 | 0.086 |
0.000 0.000 | 0.000 |
0.000 0.000 | 0.000 |
0.000 0.000 | 0.000 |
0.000 0.000 | 0.000 |
0.000 0.000 | 0.000 |
| 4 spectra, LPNQTHPDTPVGDESQAR | 1.000 | 0.000 | 0.000 | 0.000 | 0.000 | 0.000 | 0.000 | 0.000 | ||
| 4 spectra, EAVAEAVR | 0.679 | 0.000 | 0.110 | 0.000 | 0.000 | 0.117 | 0.093 | 0.000 | ||
| 7 spectra, MVCASTCYR | 0.992 | 0.000 | 0.000 | 0.000 | 0.000 | 0.000 | 0.000 | 0.008 | ||
| 2 spectra, LPGQSAAR | 1.000 | 0.000 | 0.000 | 0.000 | 0.000 | 0.000 | 0.000 | 0.000 | ||
| 1 spectrum, VLIALLESNQQK | 0.897 | 0.010 | 0.093 | 0.000 | 0.000 | 0.000 | 0.000 | 0.000 | ||
| 2 spectra, DGSVLVPAALQPYLGTDR | 0.998 | 0.000 | 0.000 | 0.000 | 0.000 | 0.000 | 0.000 | 0.002 | ||
| 2 spectra, NLLYEHAR | 0.763 | 0.127 | 0.000 | 0.000 | 0.000 | 0.091 | 0.000 | 0.018 | ||
| 1 spectrum, VVGDKPAFSFQPR | 1.000 | 0.000 | 0.000 | 0.000 | 0.000 | 0.000 | 0.000 | 0.000 | ||
| 1 spectrum, VLDMPTQELGLPAYR | 0.710 | 0.257 | 0.017 | 0.000 | 0.000 | 0.000 | 0.000 | 0.016 | ||
| 1 spectrum, YGEVTSASNCTDFQSR | 0.507 | 0.000 | 0.097 | 0.000 | 0.000 | 0.254 | 0.142 | 0.000 | ||
| 1 spectrum, GAGALLQHGLVNFTLSK | 0.668 | 0.000 | 0.158 | 0.000 | 0.000 | 0.000 | 0.173 | 0.000 | ||
| 1 spectrum, ITAPTHVPLQYIGPNQPQKPR | 0.919 | 0.000 | 0.000 | 0.081 | 0.000 | 0.000 | 0.000 | 0.000 | ||
| 3 spectra, ETQLEEEFYQQALR | 0.938 | 0.000 | 0.062 | 0.000 | 0.000 | 0.000 | 0.000 | 0.000 | ||
| 2 spectra, DPQYQGLR | 0.620 | 0.015 | 0.187 | 0.000 | 0.000 | 0.000 | 0.178 | 0.000 | ||
| 1 spectrum, GFTPMTVPDLLR | 0.844 | 0.123 | 0.033 | 0.000 | 0.000 | 0.000 | 0.000 | 0.000 |
| Plot | Mito | Lyso or Perox | ER | Golgi | PM | Cytosol | Nucleus | ||||||
| Expt B |
7 peptides |
9 spectra |
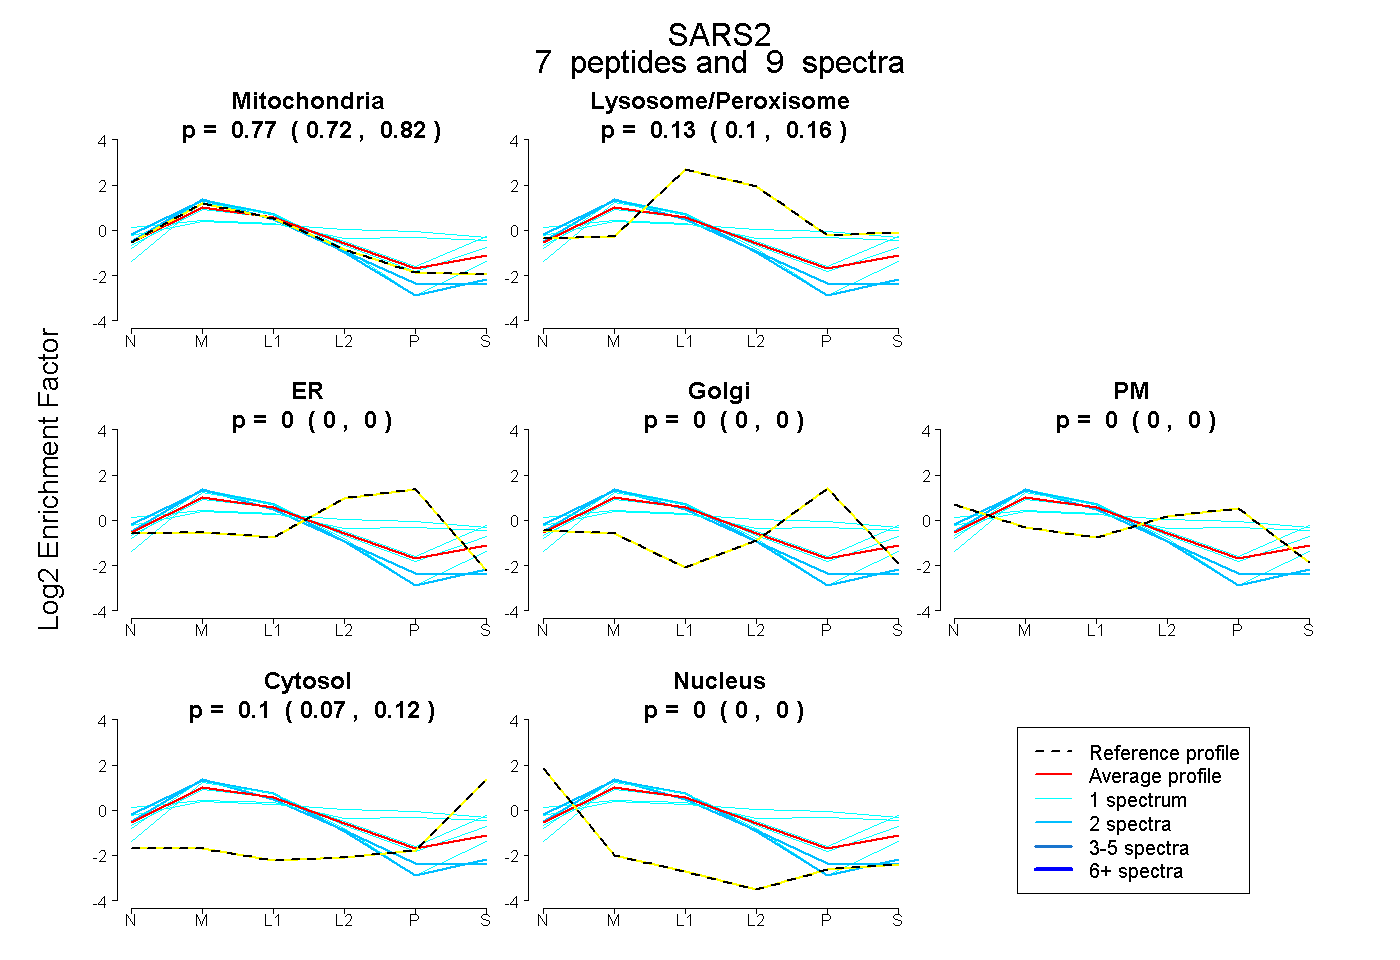 |
0.773 0.719 | 0.817 |
0.130 0.097 | 0.157 |
0.000 0.000 | 0.000 |
0.000 0.000 | 0.000 |
0.000 0.000 | 0.000 |
0.097 0.070 | 0.119 |
0.000 0.000 | 0.000 |
|||
| Plot | Lyso | Other | |||||||||||
| Expt C |
18 peptides |
71 spectra |
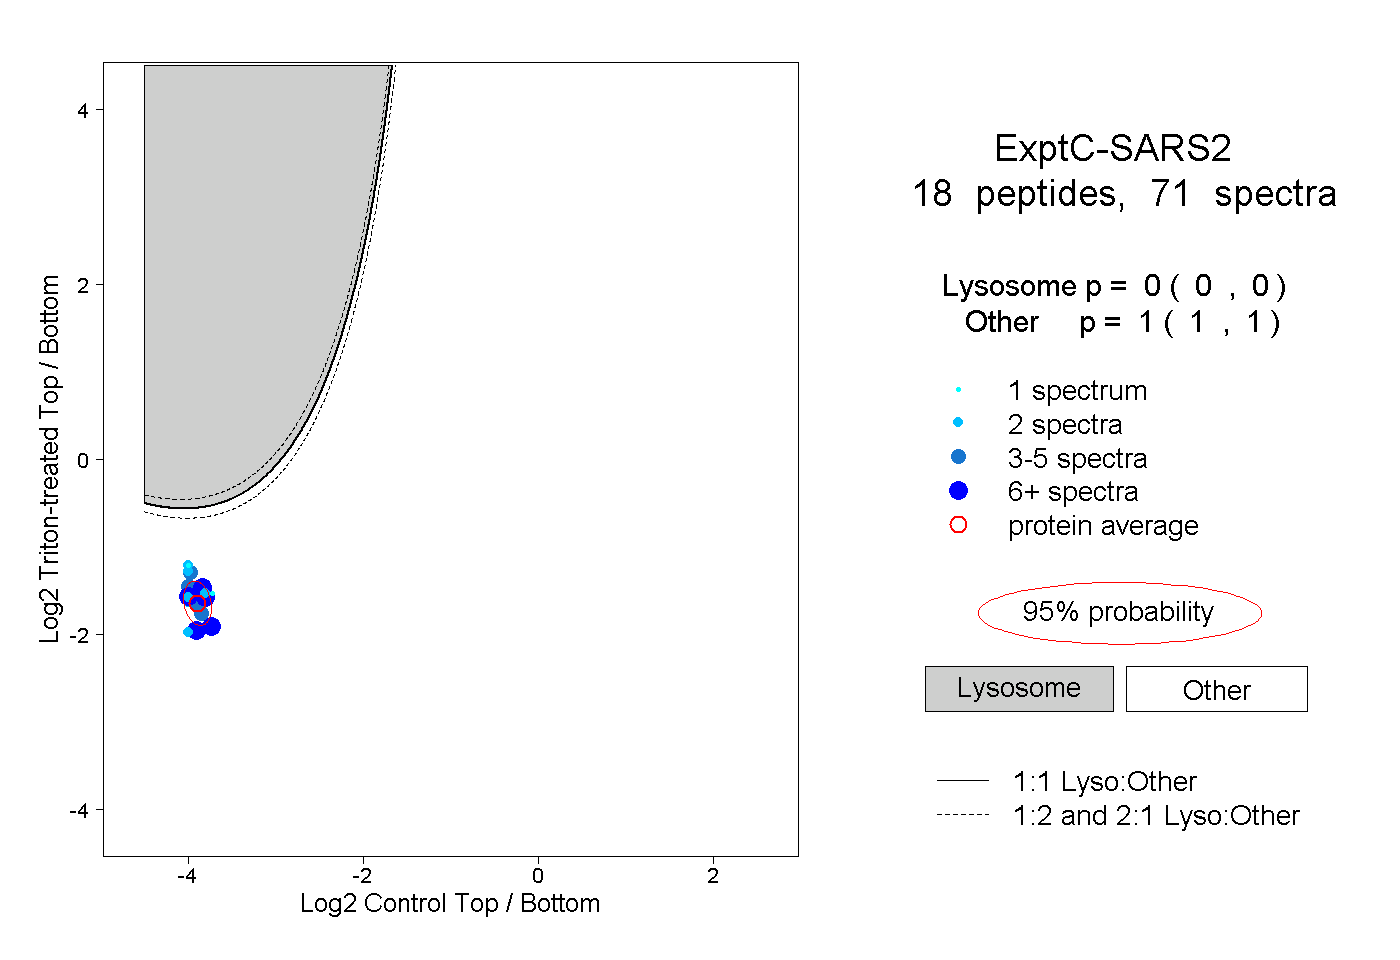 |
0.000 0.000 | 0.000 |
1.000 1.000 | 1.000 |
||||||||
| Plot | Lyso | Other | |||||||||||
| Expt D |
2 peptides |
5 spectra |
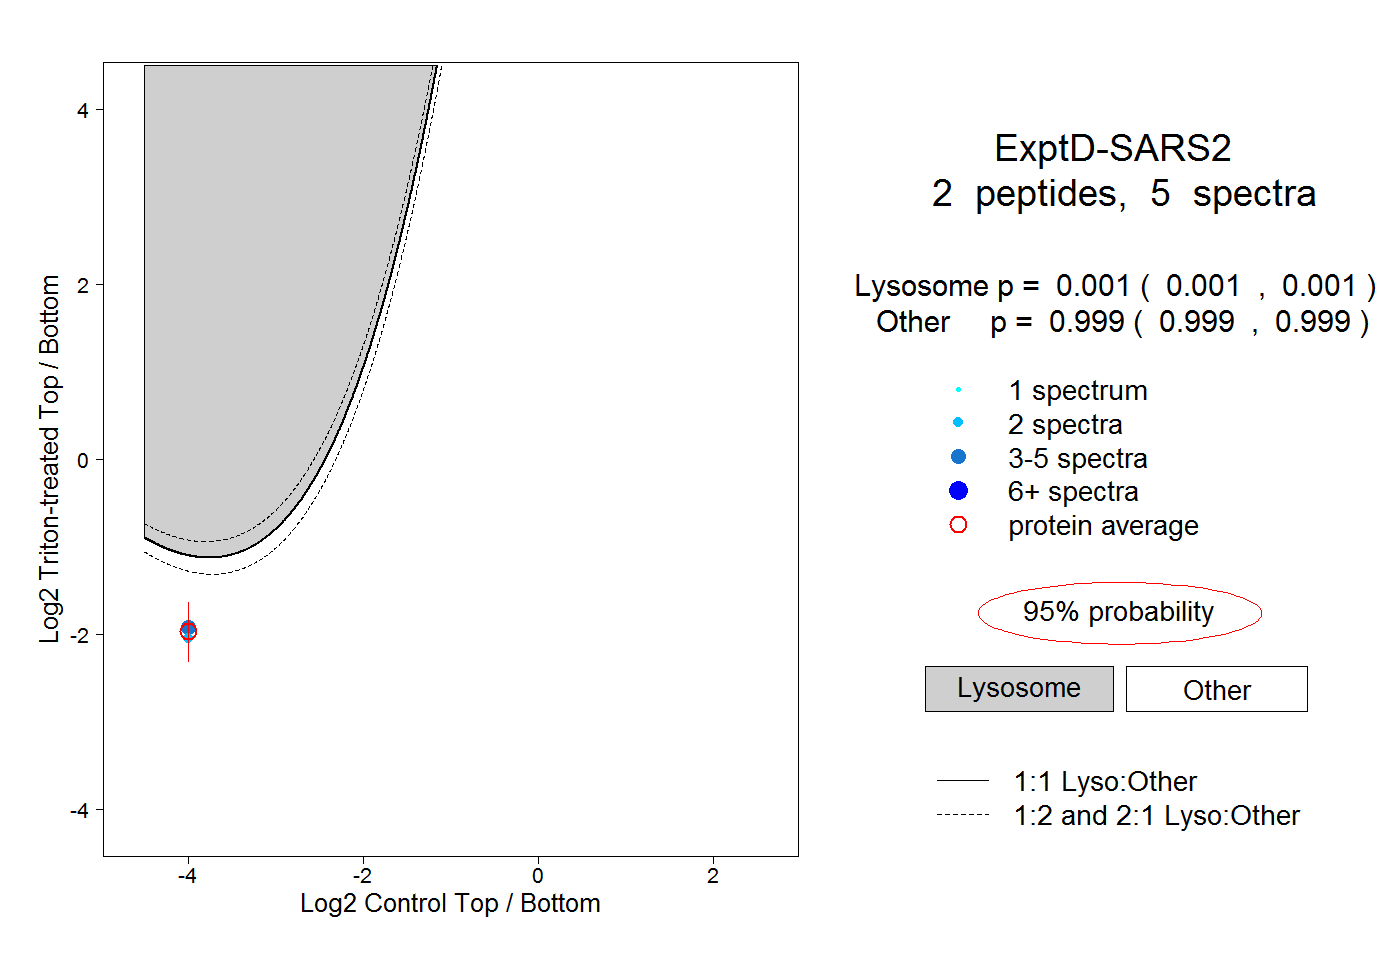 |
0.001 0.001 | 0.001 |
0.999 0.999 | 0.999 |