 3
3peptides
spectra
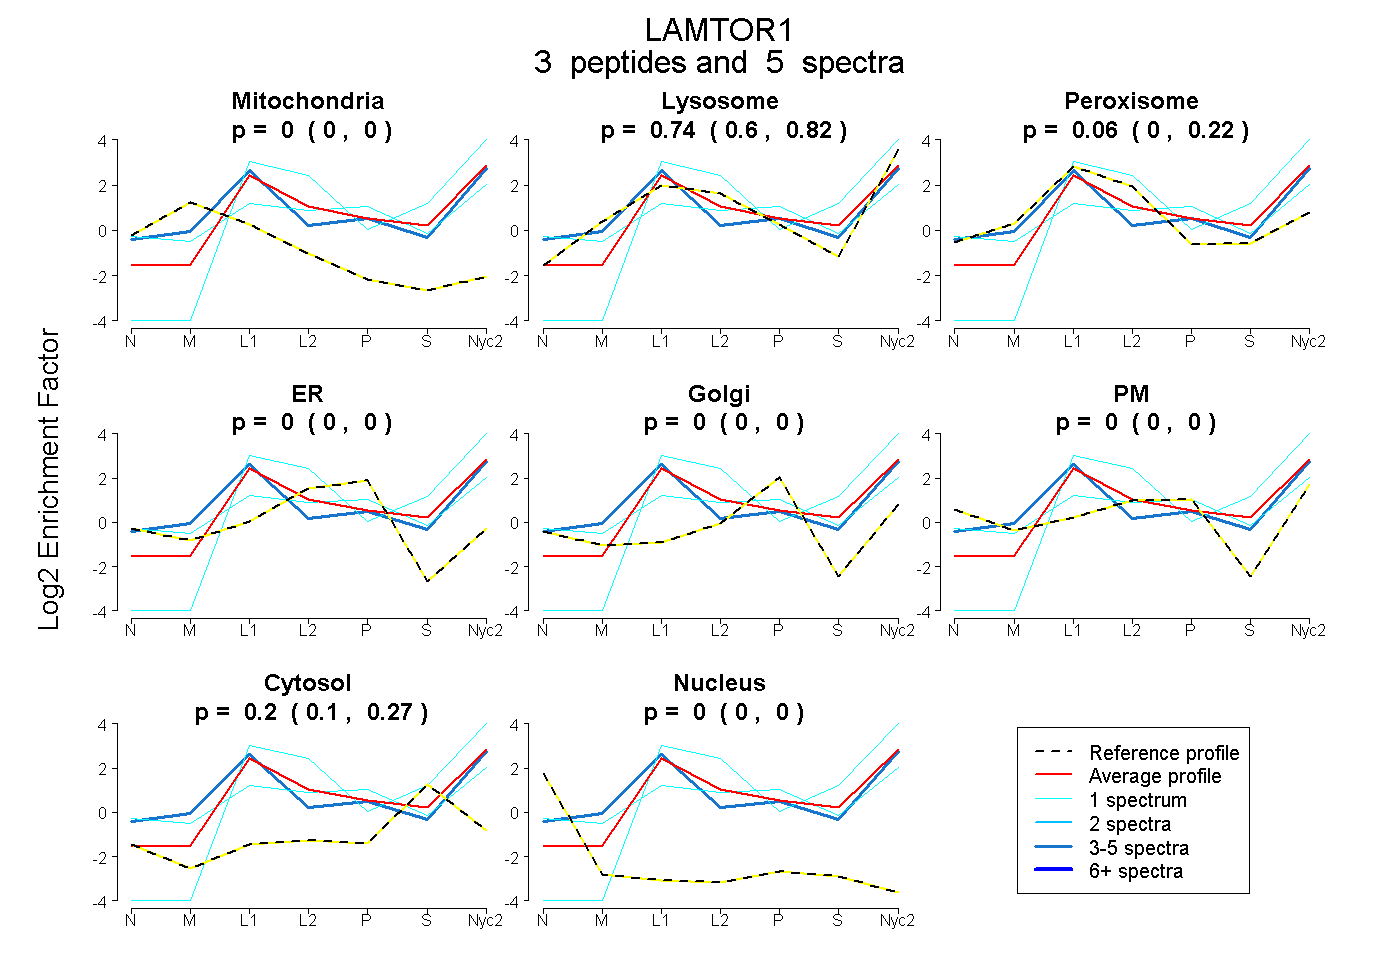
0.000 | 0.000
0.601 | 0.817
0.000 | 0.223
0.000 | 0.000
0.000 | 0.000
0.000 | 0.000
0.096 | 0.268
0.000 | 0.000
2peptides
spectra
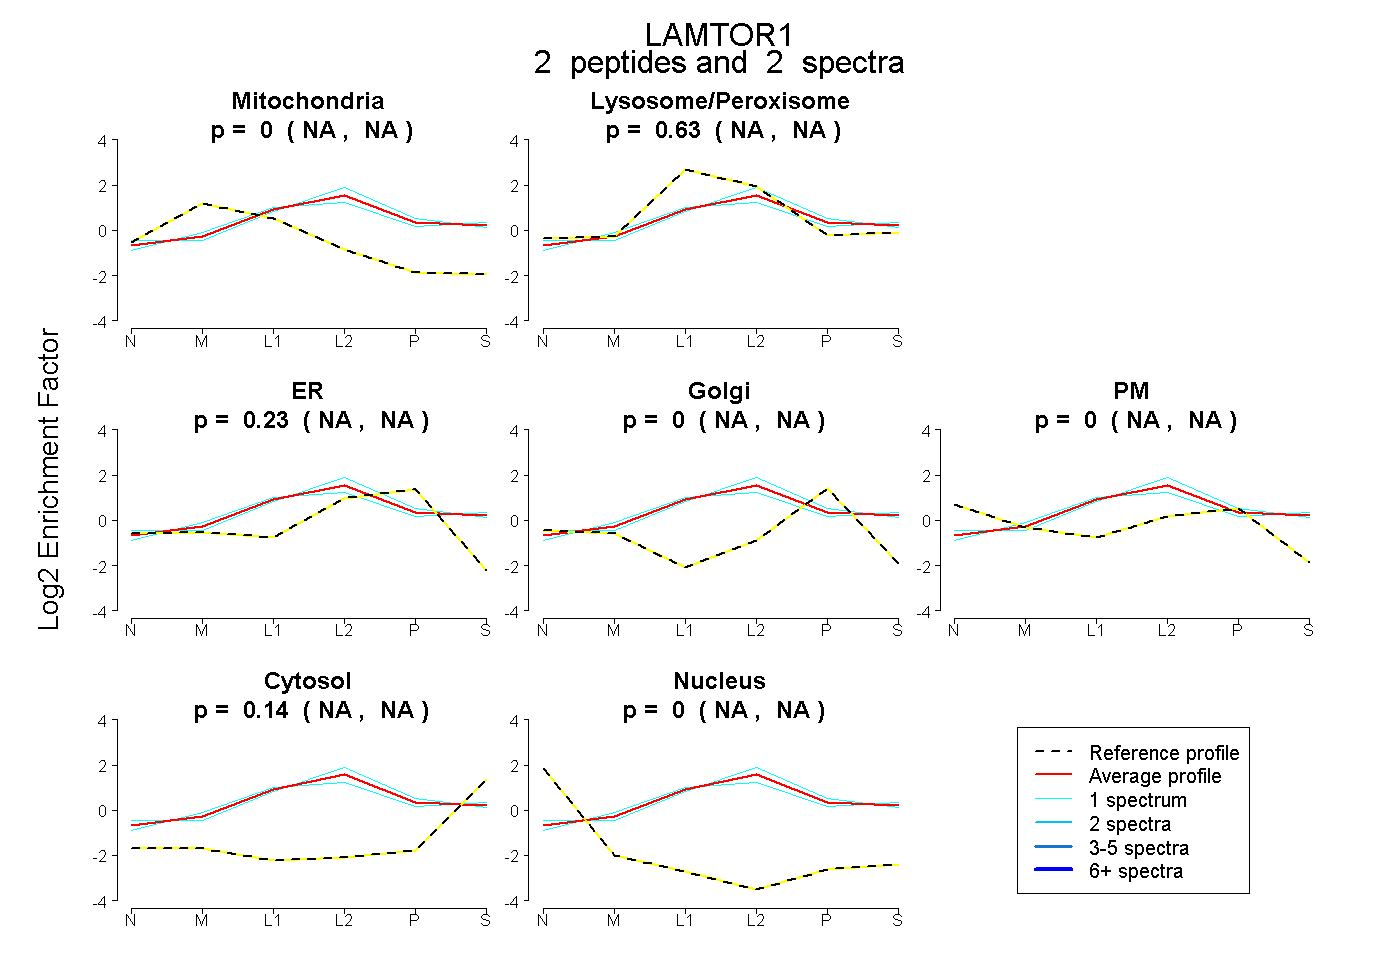
NA | NA
NA | NA
NA | NA
NA | NA
NA | NA
NA | NA
NA | NA
3peptides
spectra
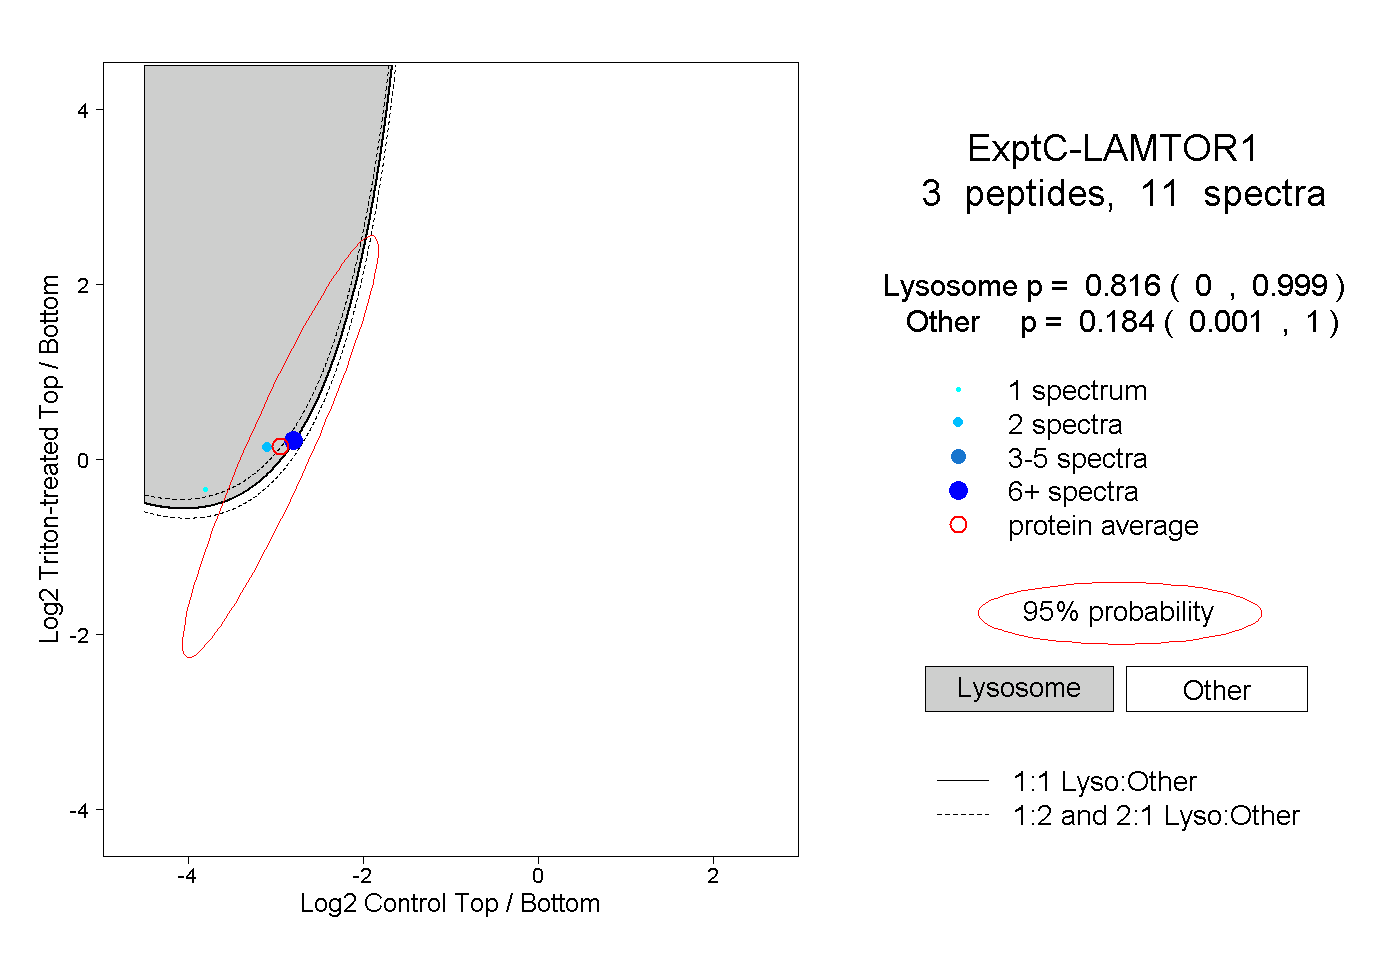
0.000 | 0.999
0.001 | 1.000
2peptides
spectra
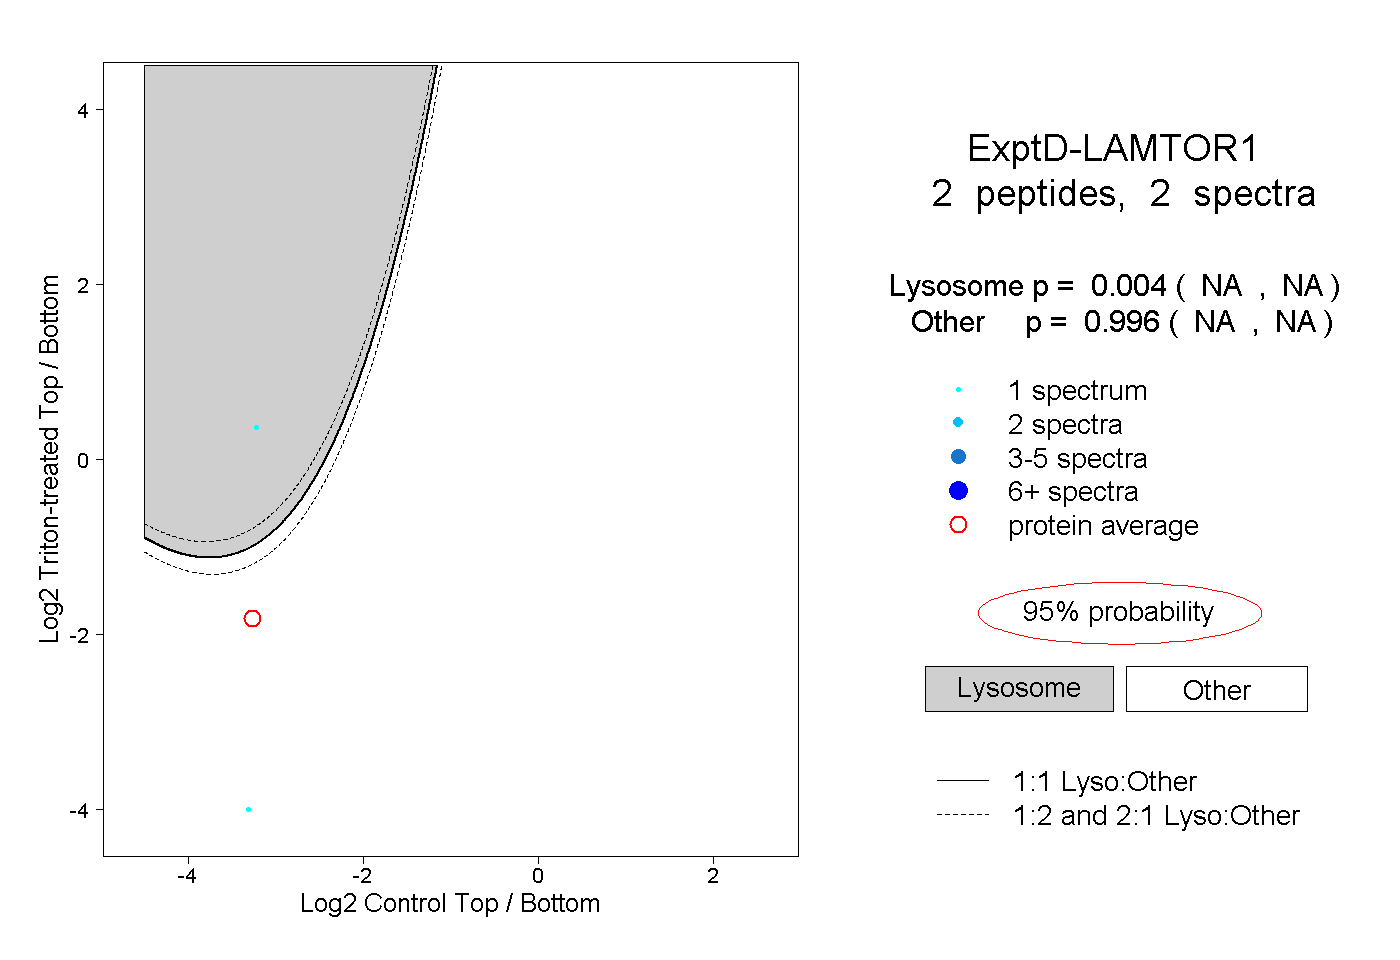
NA | NA
NA | NA