 1
1peptide
spectra
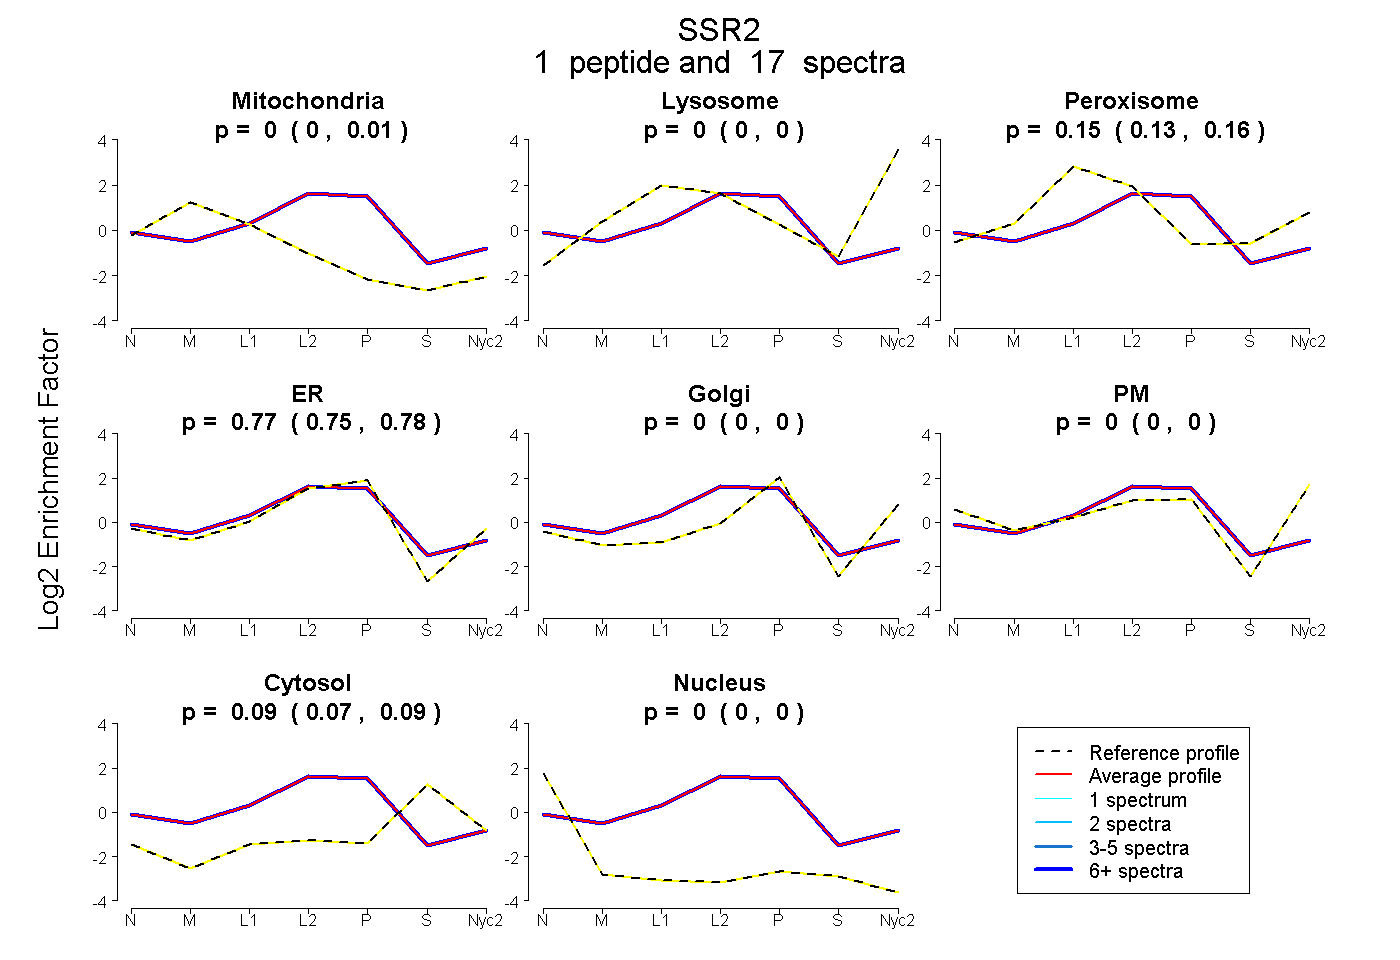
0.000 | 0.010
0.000 | 0.000
0.134 | 0.156
0.749 | 0.781
0.000 | 0.000
0.000 | 0.000
0.071 | 0.095
0.000 | 0.000
2peptides
spectra
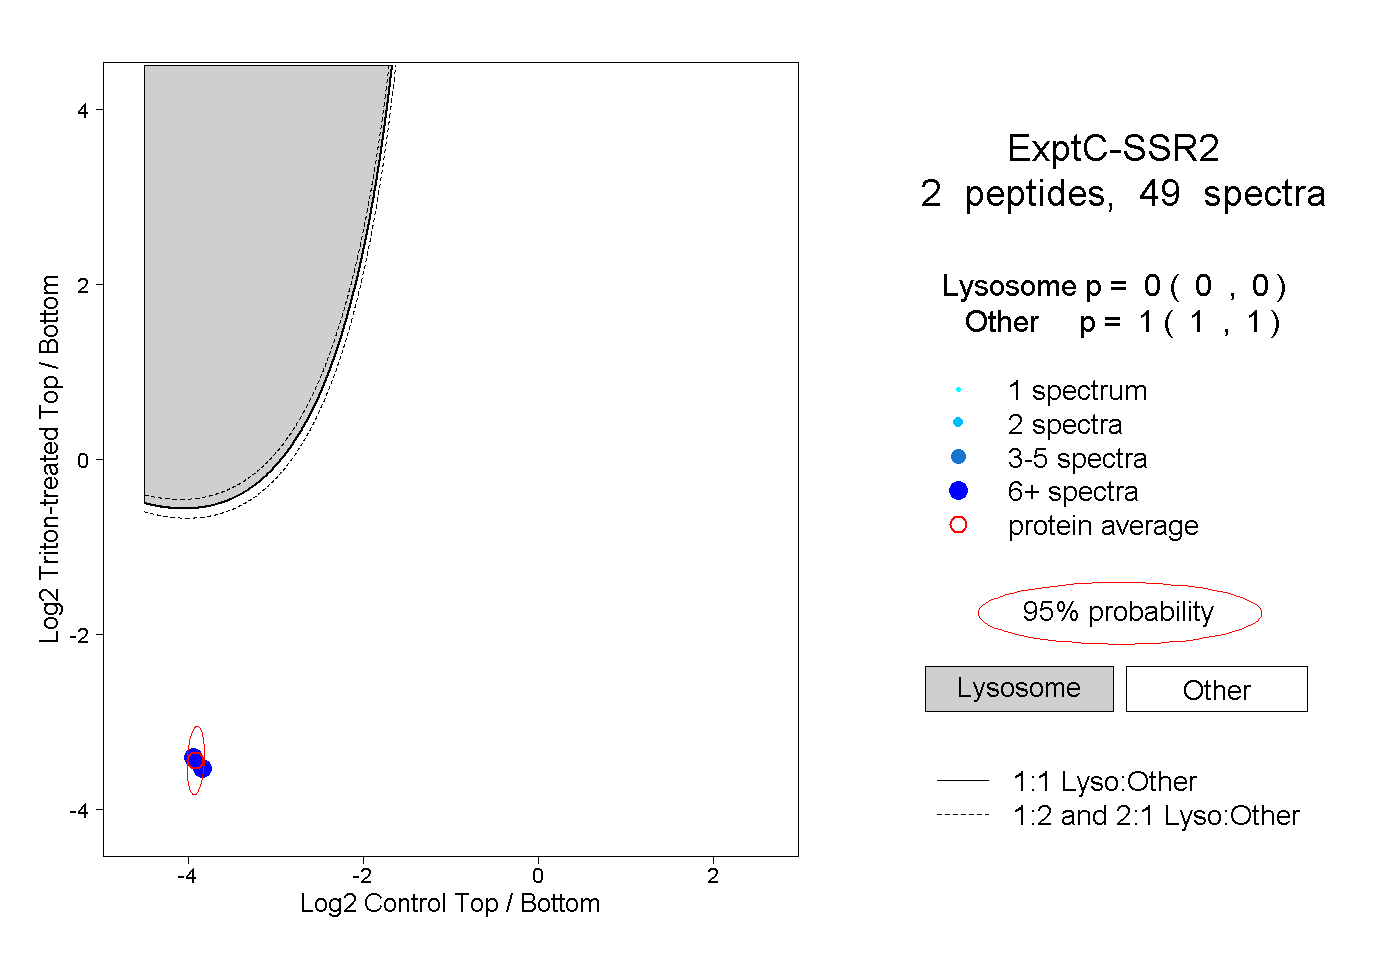
0.000 | 0.000
1.000 | 1.000
1peptide
spectra
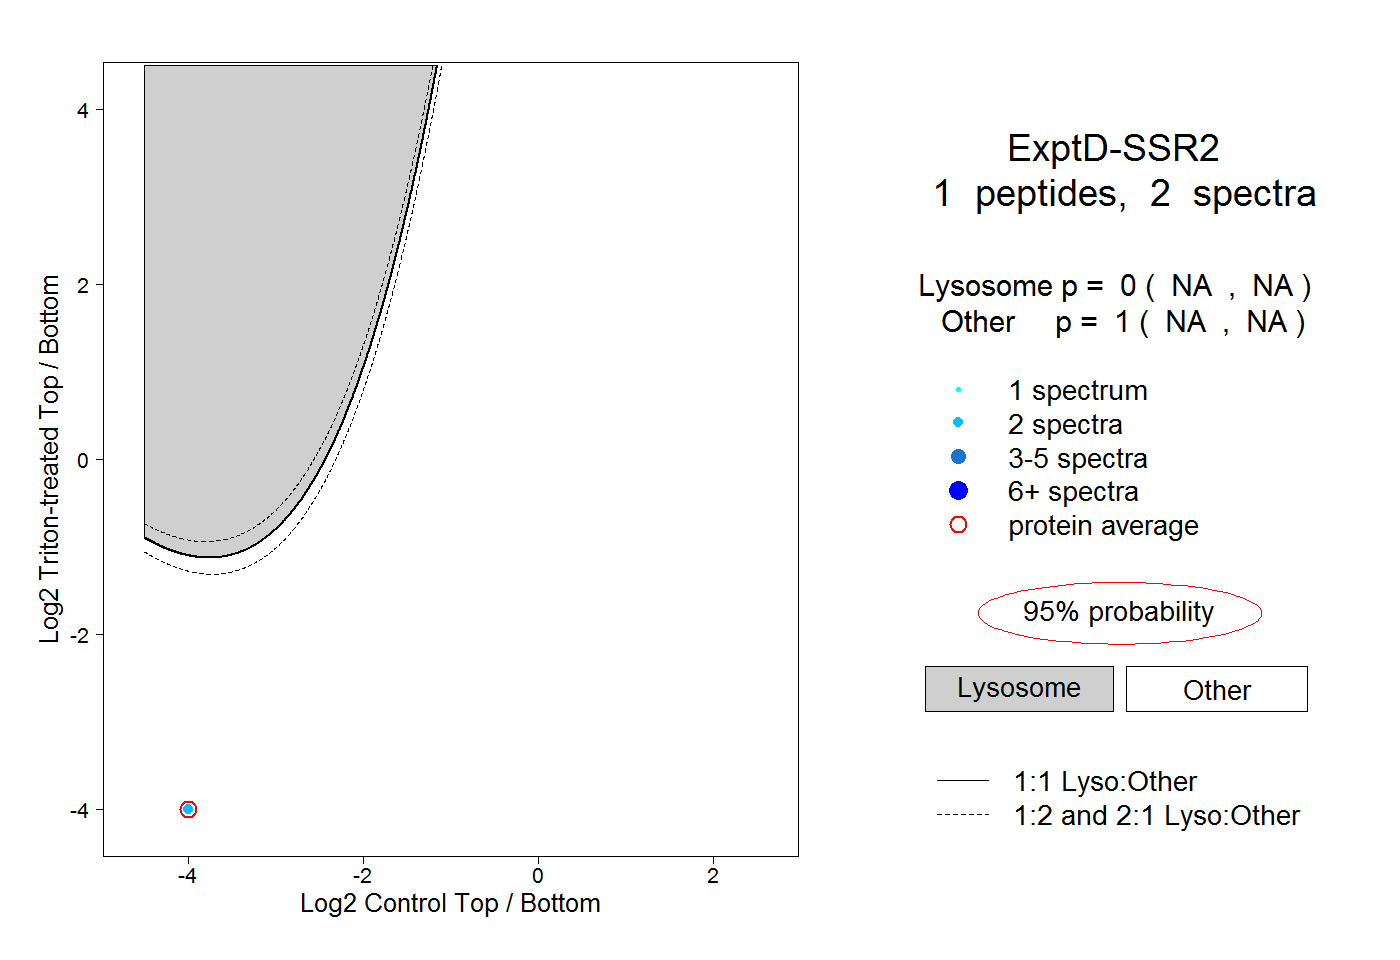
NA | NA
NA | NA